


FXOpen

LTC/USD
From last Thursday, November 26th when the price of Litecoin was sitting at the $65 level, we have seen an increase of 42.64% measured to its highest point at $92.664 made on Tuesday. Since then the price has been moving sideways, spiking to the downside at first but then making a series of lower highs. Currently, it is being traded $90 and is starting to move to the upside again.
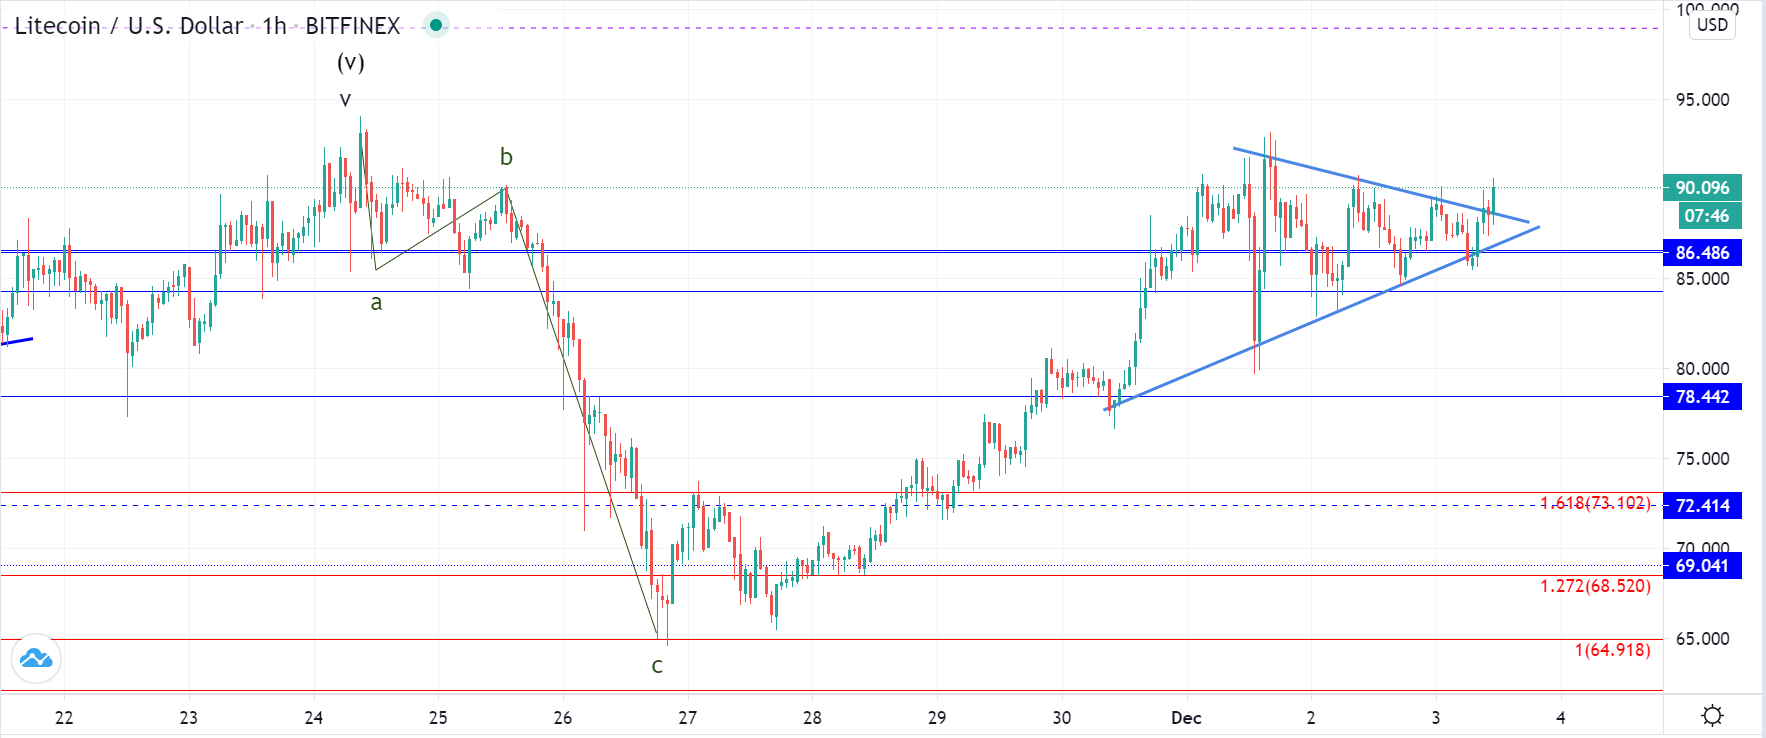
On the hourly chart, you can see that the price formed a symmetrical triangle from Tuesday’s high around the significant horizontal level at $86.486. Now we are seeing an attempt for a breakout to the upside after the price reached its apex.
It is currently making a higher high compared to the last one and has started going above the territory of the triangle, moving above its resistance level. A breakout looks like developing but can still end as a fakeout on the hourly time-frame.
If we see further upside movement with the hourly candle closing above the prior local high the breakout would be validated and would indicate further price growth. This rise would be the uptrend continuation from last Thursday and would be the ending wave from the five-wave impulse that is set to push the price above its higher degree high made on the 24th of November after which a significant corrective descending move was made.
EOS/USD
The price of EOS has also been increasing from last Thursday, coming from $2.77 area to $3.315 which was an increase of 19.26%, but has since then fallen to $3 and is currently being traded at $3.1.
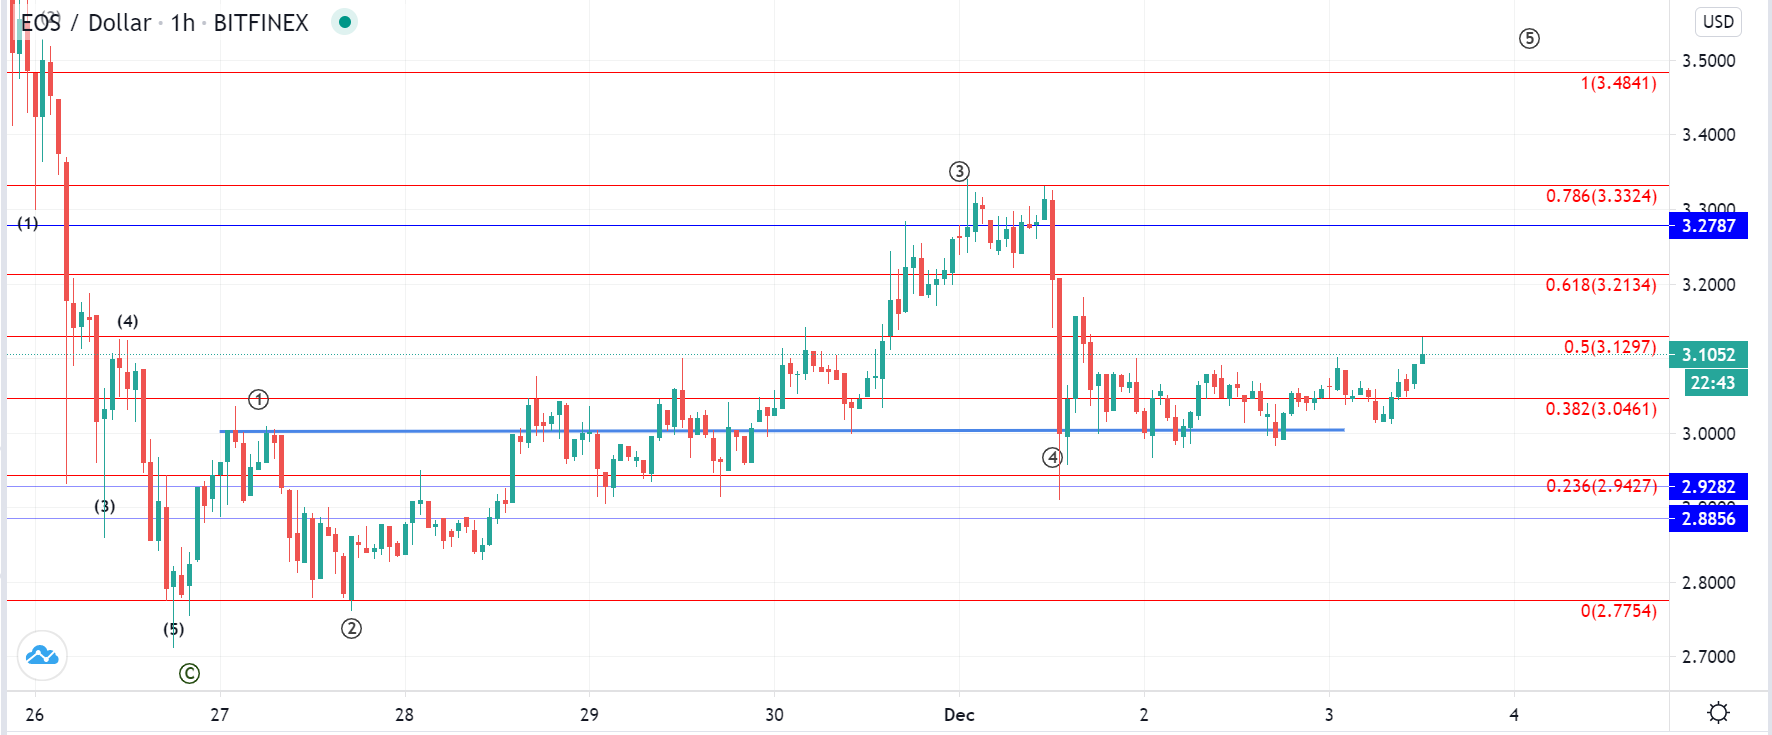
On the hourly chart, we can see that the price has started moving the to upside again after falling back to the levels of the 1st wave’s ending point after a previous higher degree descending move. This is why there is still a possibility that the price is developing its 5th wave from the impulsive five-wave move to the upside.
If that is the case then we could see it increasing past its highest point in December made last Thursday when it found resistance at the 0.786 Fib level. The price is likely to continue increasing from here but it could very well be another corrective move before the further decline is made so we are yet to see if it manages to break the Fib level resistance and continues for a higher high. Significant horizontal resistance is sitting around $3.3 area so it might end as a truncation before its completion.
FXOpen offers the world's most popular cryptocurrency CFDs*, including Bitcoin and Ethereum. Floating spreads, 1:2 leverage — at your service. Open your trading account now or learn more about crypto CFD trading with FXOpen.
*At FXOpen UK and FXOpen AU, Cryptocurrency CFDs are only available for trading by those clients categorised as Professional clients under FCA Rules and Professional clients under ASIC Rules respectively. They are not available for trading by Retail clients.
This article represents the opinion of the Companies operating under the FXOpen brand only. It is not to be construed as an offer, solicitation, or recommendation with respect to products and services provided by the Companies operating under the FXOpen brand, nor is it to be considered financial advice.
Latest from Cryptocurrencies
Latest articles

What Order Imbalance Is and How To Use It in a Trading Strategy
Understanding the nuances of order imbalances is key for traders looking to navigate the ebb and flow of asset prices. Order imbalances provide a clear window into the supply and demand dynamics at play, offering strategic insights. This article delves

XAU/USD Gold Price Reaches an Important Resistance Zone
The XAU/USD gold chart today indicates that the historical record price of the metal is above USD 2,400 per ounce.
In addition to fears of a new round of inflation due to rising commodity prices, geopolitical tensions are

What Is a Break of Structure and How Can You Trade It?
In the ever-evolving world of Smart Money Concept (SMC) trading, a nuanced understanding of market dynamics is indispensable. This article explores the concept of Break of Structure (BOS), how to identify it, and its implications for trading strategies, setting traders