


FXOpen
LTC/USD
From last Thursday, November 26th when the price of Litecoin was sitting at the $65 level, we have seen an increase of 42.64% measured to its highest point at $92.664 made on Tuesday. Since then the price has been moving sideways, spiking to the downside at first but then making a series of lower highs. Currently, it is being traded $90 and is starting to move to the upside again.
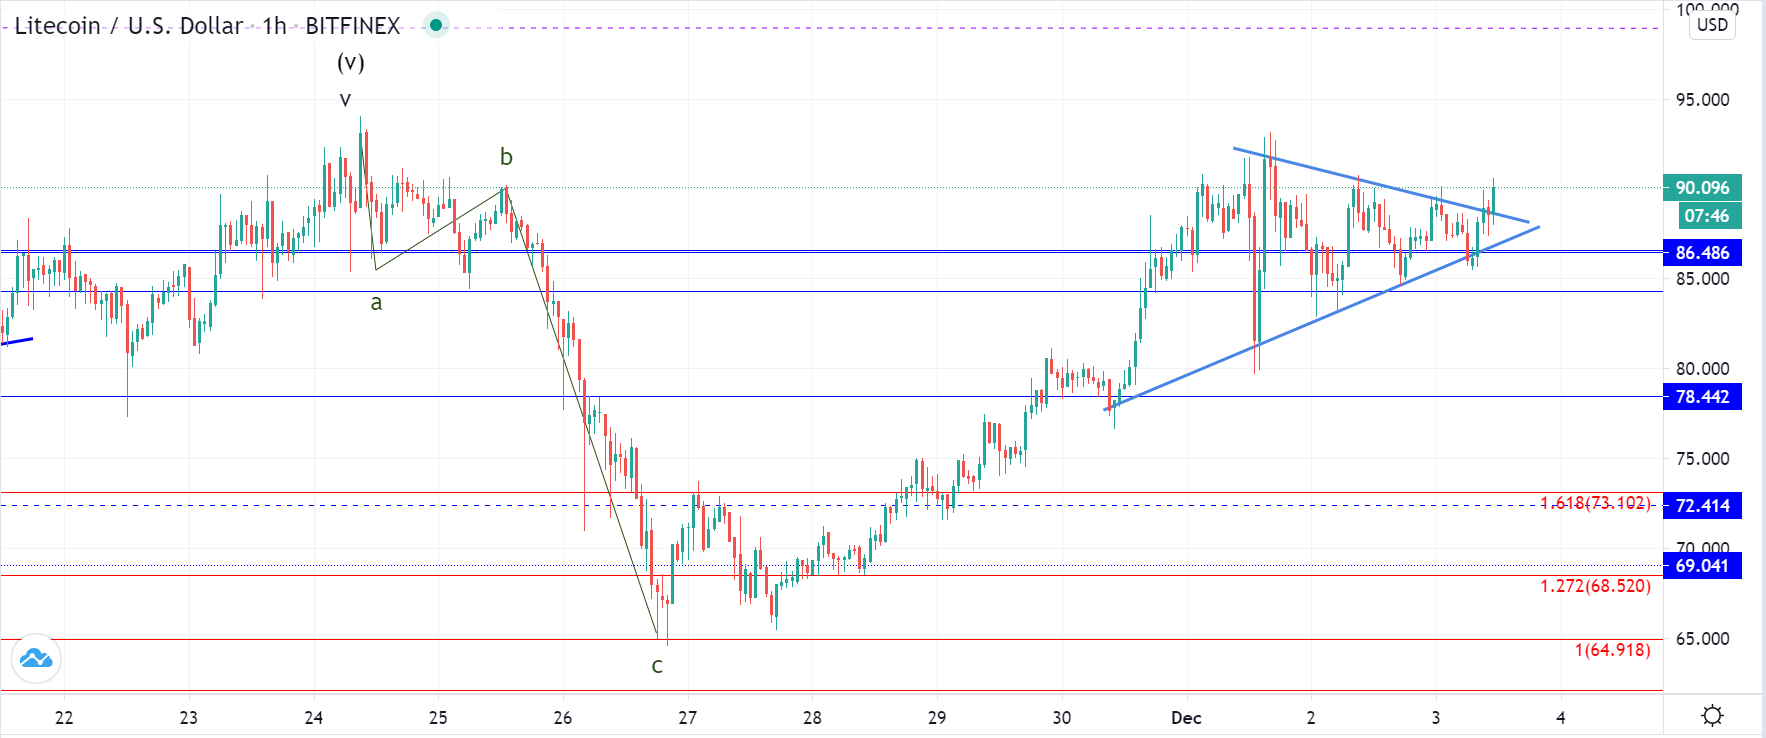
On the hourly chart, you can see that the price formed a symmetrical triangle from Tuesday’s high around the significant horizontal level at $86.486. Now we are seeing an attempt for a breakout to the upside after the price reached its apex.
It is currently making a higher high compared to the last one and has started going above the territory of the triangle, moving above its resistance level. A breakout looks like developing but can still end as a fakeout on the hourly time-frame.
If we see further upside movement with the hourly candle closing above the prior local high the breakout would be validated and would indicate further price growth. This rise would be the uptrend continuation from last Thursday and would be the ending wave from the five-wave impulse that is set to push the price above its higher degree high made on the 24th of November after which a significant corrective descending move was made.
EOS/USD
The price of EOS has also been increasing from last Thursday, coming from $2.77 area to $3.315 which was an increase of 19.26%, but has since then fallen to $3 and is currently being traded at $3.1.
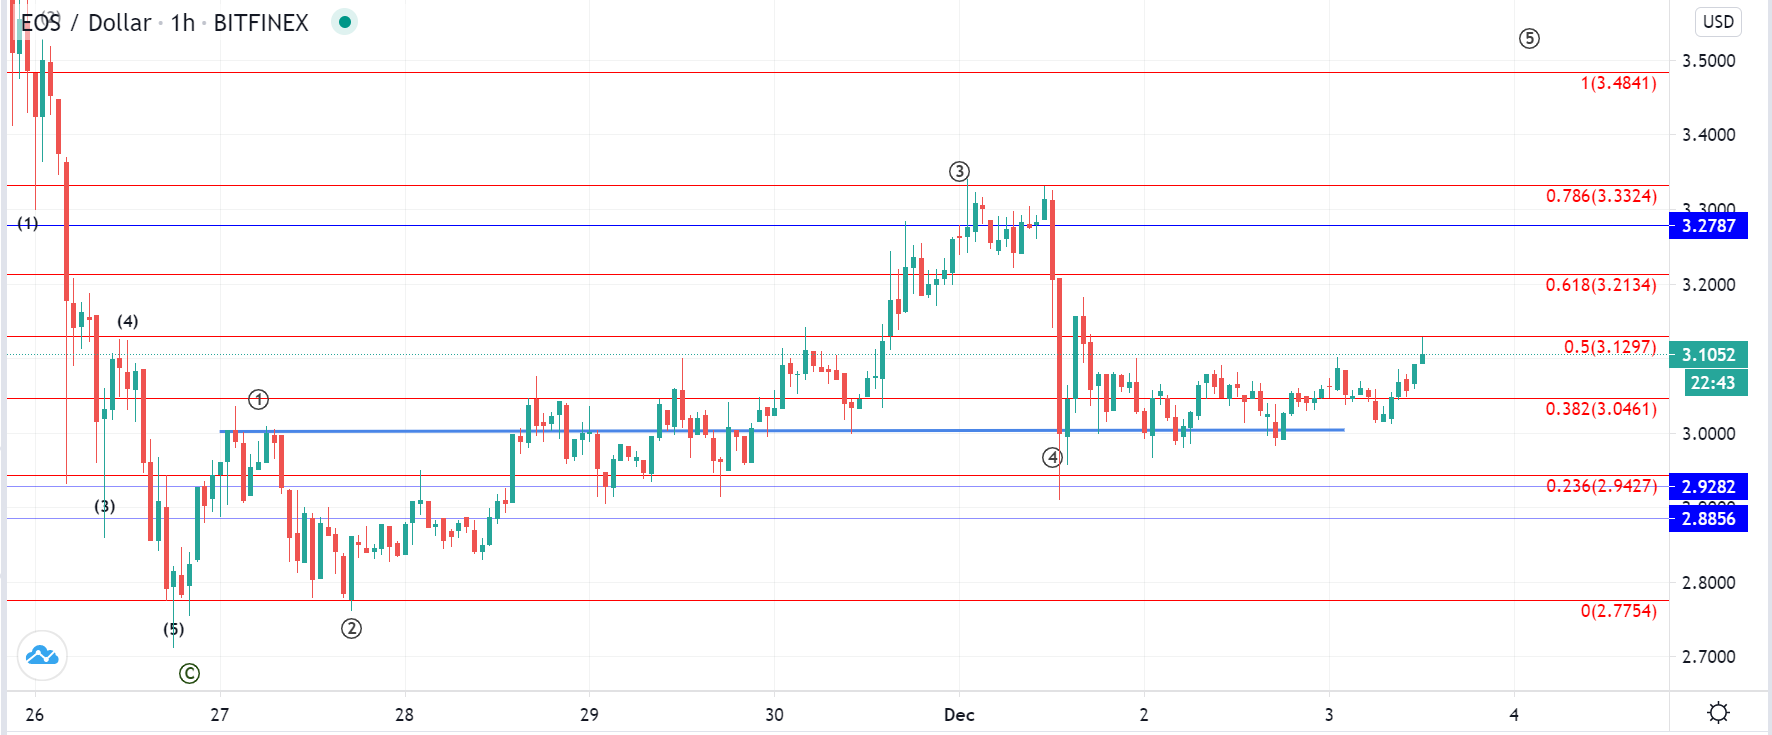
On the hourly chart, we can see that the price has started moving the to upside again after falling back to the levels of the 1st wave’s ending point after a previous higher degree descending move. This is why there is still a possibility that the price is developing its 5th wave from the impulsive five-wave move to the upside.
If that is the case then we could see it increasing past its highest point in December made last Thursday when it found resistance at the 0.786 Fib level. The price is likely to continue increasing from here but it could very well be another corrective move before the further decline is made so we are yet to see if it manages to break the Fib level resistance and continues for a higher high. Significant horizontal resistance is sitting around $3.3 area so it might end as a truncation before its completion.
FXOpen offers the world's most popular cryptocurrency CFDs*, including Bitcoin and Ethereum. Floating spreads, 1:2 leverage — at your service. Open your trading account now or learn more about crypto CFD trading with FXOpen.
*At FXOpen UK and FXOpen AU, Cryptocurrency CFDs are only available for trading by those clients categorised as Professional clients under FCA Rules and Professional clients under ASIC Rules respectively. They are not available for trading by Retail clients.
This article represents the opinion of the Companies operating under the FXOpen brand only. It is not to be construed as an offer, solicitation, or recommendation with respect to products and services provided by the Companies operating under the FXOpen brand, nor is it to be considered financial advice.
Latest articles

AUD/USD Analysis: Aussie Weakens After RBA Decision
Following its decision on 7th May, the Reserve Bank of Australia (RBA) opted to maintain the interest rate at 4.35%, despite inflation continuing to decrease at a slower pace than anticipated by the RBA.
"I think we still think

The Hang Seng Index Has Risen by Over 13% in 2 Weeks
Analyzing the Hang Seng (Hong Kong 50 at FXOpen) chart, we wrote on January 30th that the price was near an important support level formed by the lower boundary (shown in orange) of a long-term channel, which has been relevant

Turtle Trading: System, Rules, and Strategy
In the 1980s, the Turtle Trading system was born from a debate about whether trading skills were innate or could be taught. Richard Dennis and William Eckhardt decided to train novices in their trend-following trading strategies, thus giving rise to