


FXOpen

LTC/USD
The price of Litecoin has been in a decline from Saturday’s high when it came up to $247. From there we have seen a downfall of 35.8% measured to its lowest point of the week made on Tuesday at $158.56. We have seen a minor recovery as the price made a rise to the $190 area but has since pulled back again and is currently sitting just below $180.
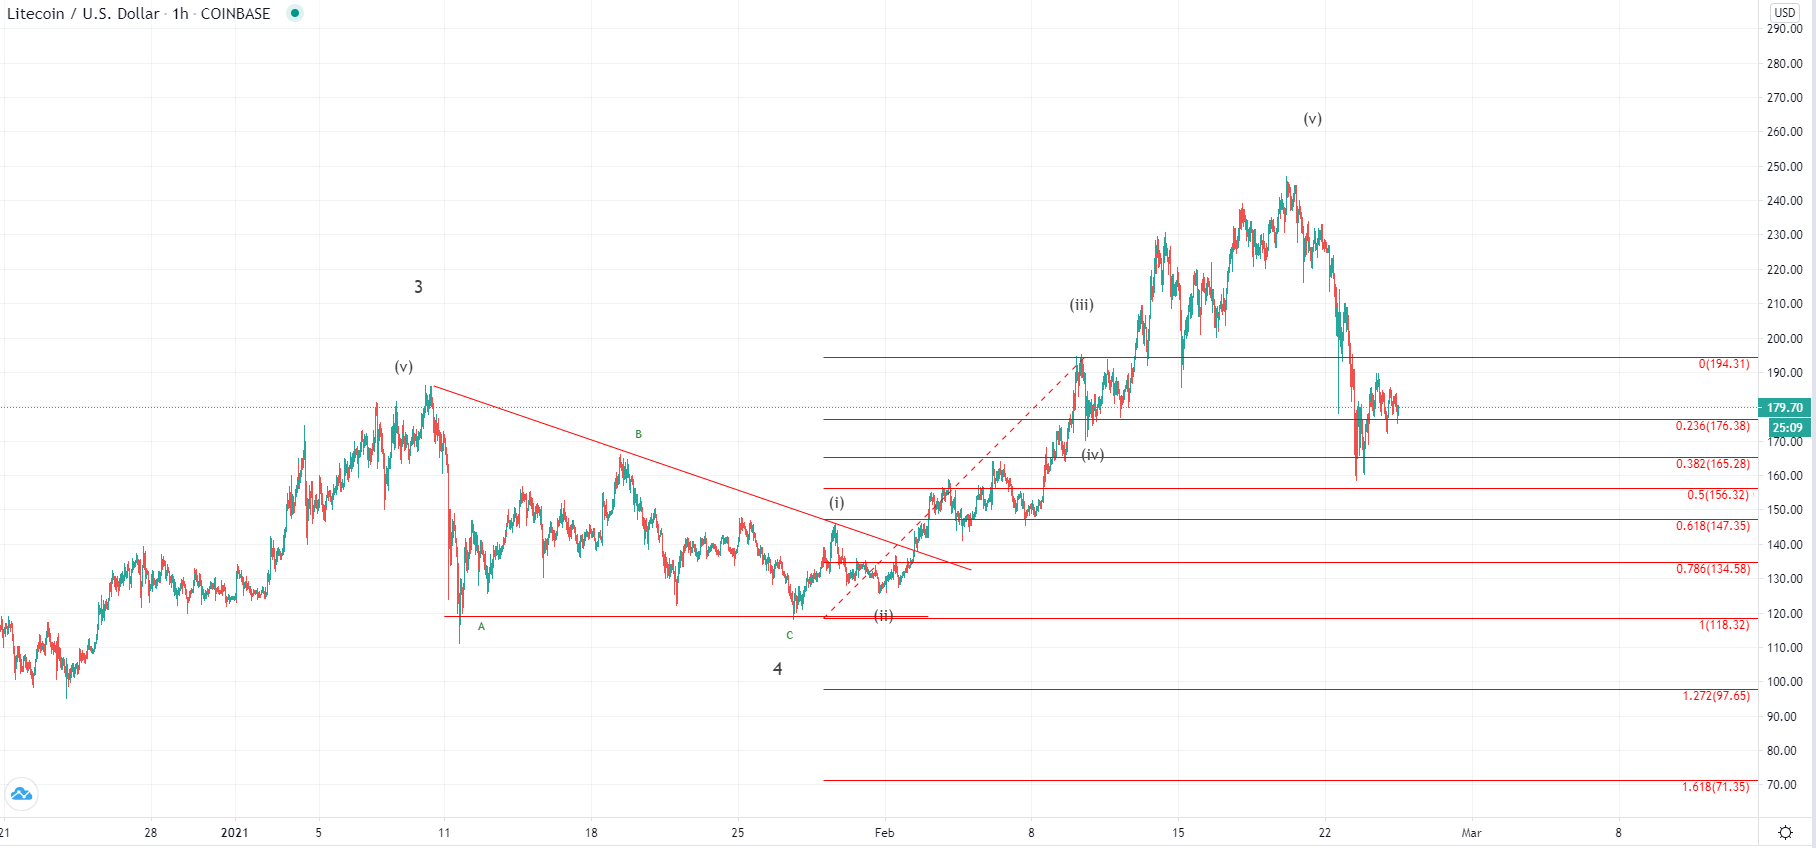
Looking at the hourly chart, you can see that the price of Litecoin has fallen back to the 0.236 Fib level which was the horizontal resistance point of the prior high made on the 10th of January. It dipped below it which could serve as an early indication that the previous uptrend ended, but it managed to go back above it and is currently testing it for support. If the support gets validated at these levels we could see further uptrend continuation of the impulse wave that started on the 27th of January.
However, if the price continues moving to the downside again and makes it into the lower range it would be a stronger indication that the price of Litecoin has ended its previous impulsive move and is now headed towards a correction of the higher degree out of which the downfall from last Saturday was only its 1st sub-wave.
EOS/USD
From Tuesday’s low at $3.18 the price of EOS has recovered by 29% as it came up to $4,107 at its highest point but started decreasing again and is currently sitting at around $3.935 moving sideways.
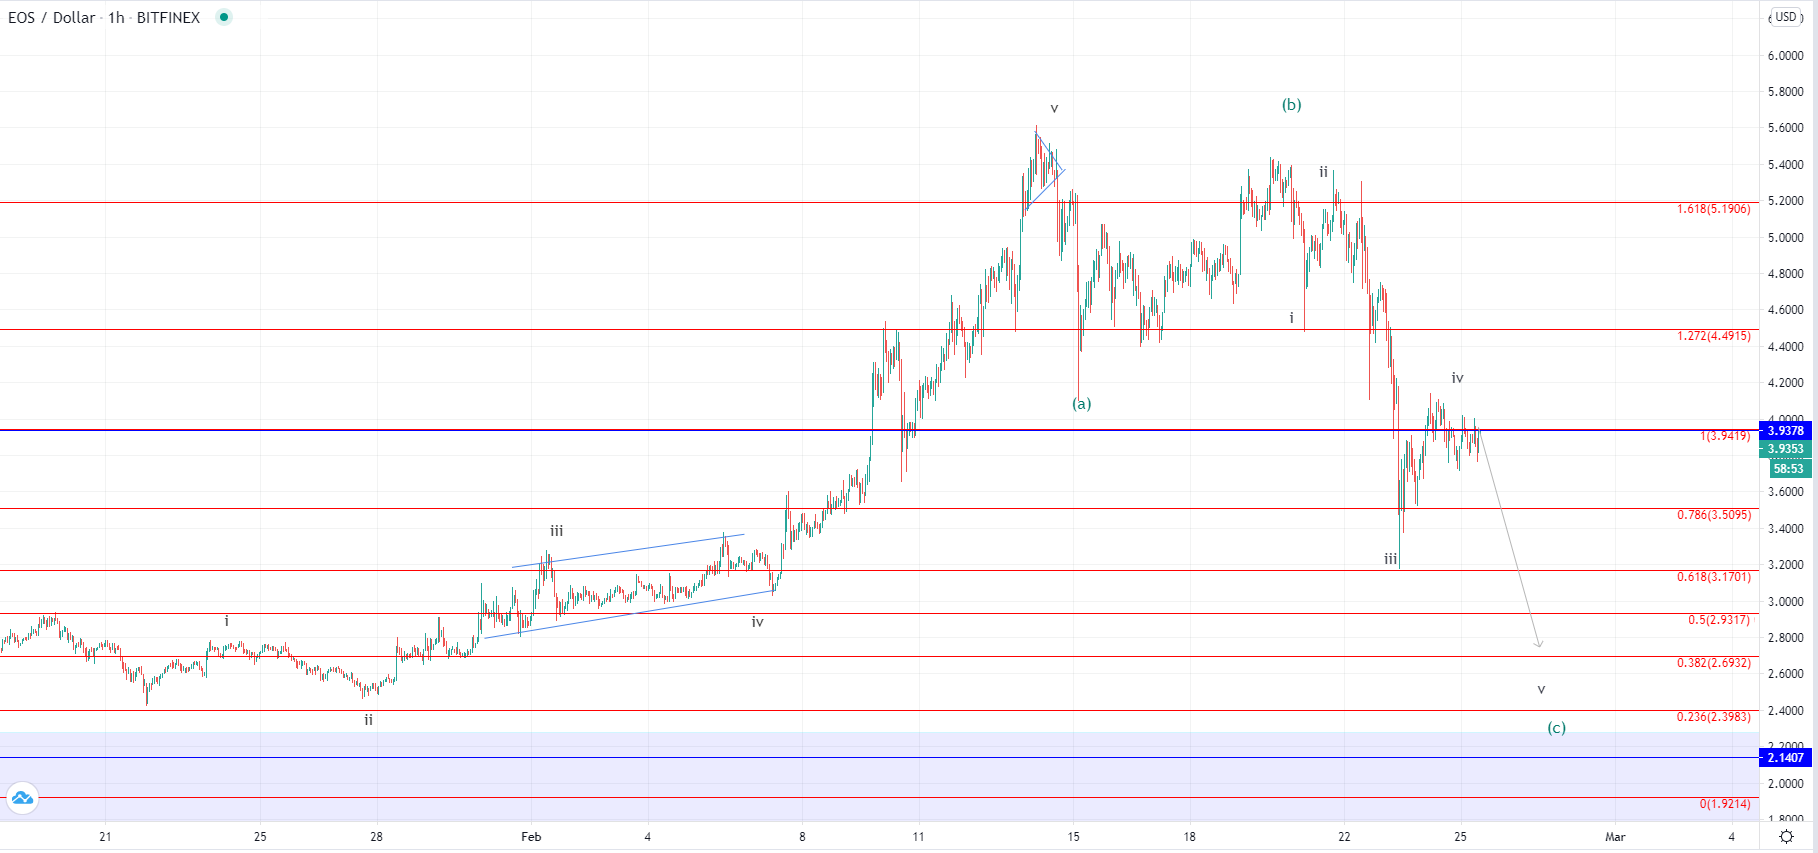
On the hourly chart, we can see that the price of EOS is testing the 1 Fib level for resistance at the moment and is being traded on its lower side. This could be the continuation of the downward five-wave impulse from the 20th of February when it started its 3rd wave to the downside after the prior increase ended. If this is the C wave from the higher degree ABC then it should be sub-divided into a five-wave impulse.
As the price could have ended its 4th wave out of the mentioned five-wave impusle, now the 5th one would be expected to develop, potentially pushing the price back to the 0.382 Fib level at around $2.7. The price should then proceed to establish support and continue moving to the upside again as the uptrend of the higher degree would continue but it could also be set for a corrective recovery before further downside continuation which we will see after the interaction with the expected support zone at around $2.7.
This forecast represents FXOpen Markets Limited opinion only, it should not be construed as an offer, invitation or recommendation in respect to FXOpen Markets Limited products and services or as financial advice.
Cryptocurrency CFDs are not available to trade in all jurisdictions.
FXOpen offers the world's most popular cryptocurrency CFDs*, including Bitcoin and Ethereum. Floating spreads, 1:2 leverage — at your service. Open your trading account now or learn more about crypto CFD trading with FXOpen.
*At FXOpen UK and FXOpen AU, Cryptocurrency CFDs are only available for trading by those clients categorised as Professional clients under FCA Rules and Professional clients under ASIC Rules respectively. They are not available for trading by Retail clients.
This article represents the opinion of the Companies operating under the FXOpen brand only. It is not to be construed as an offer, solicitation, or recommendation with respect to products and services provided by the Companies operating under the FXOpen brand, nor is it to be considered financial advice.
Latest from Cryptocurrencies
Latest articles

Weekly Market Wrap With Gary Thomson: UK100, USD, GOLD, OIL
Get the latest scoop on the week's hottest headlines, all in one convenient video. Join Gary Thomson, the COO of FXOpen UK, as he breaks down the most significant news reports and shares his expert insights.
- UK100 Share Index Rises

What Is a Darvas Box Theory and How Does It Work in Trading?
The Darvas Box Theory, pioneered by Nicolas Darvas in the 1950s, has transcended its stock market origins to become a valuable tool for forex traders. This method leverages specific price movements and patterns, known as the Darvas Box, to track

NFLX Stock Price Falls Despite Subscriber Growth
Yesterday, after the close of the main trading session on the stock market, Netflix reported to investors for the 1st quarter of 2024.
The report turned out better than expected:
→ earnings per share: actual = USD 5.28, forecast = USD 4.