


FXOpen

LTC/USD
The price of Litecoin reached $148 on the 4th of July which was the same level as on the prior high. From there we have seen the start of a descending move and is currently being traded at $130 and is still in a downward trajectory.
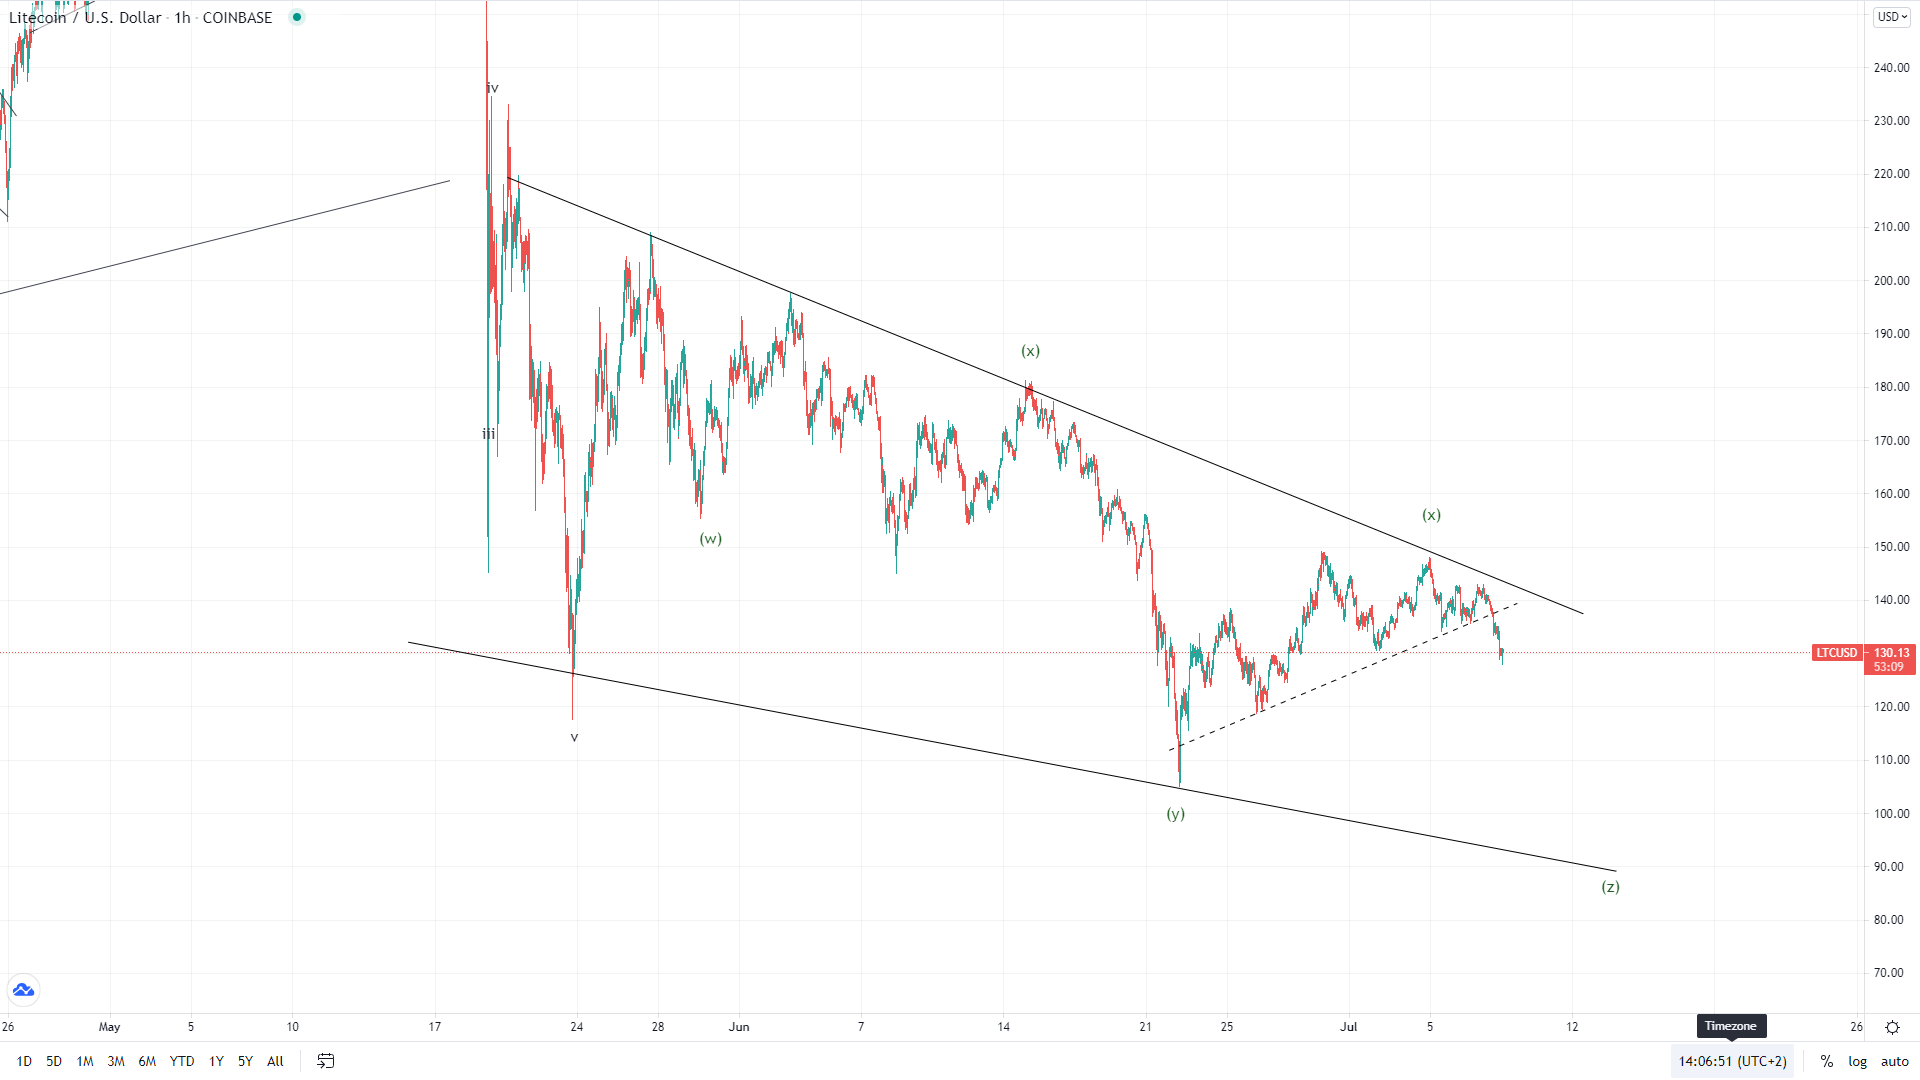
On the hourly chart, you can see that the price broke out from the ascending support level from the 22nd of June. This is the first signal that the prior recovery ended and now we have seen the start of a descending move of the same degree as the one that lasted from the 22nd of June till the 4th of July.
July 4th high came up to the descending trendline which is the upper level of the descending triangle which formed from the 23rd of May. As the price found resistance again this validated that the previous recovery was corrective in nature in conjunction with the wave structure. This is why it is counted as the 4th corrective wave with now most likely the 5th one to the downside developing.
If this is true then we are to see a lower low compared to the one on the 22nd of June when the price of Litecoin fell to $105 area. If the descending triangle is still in play another third interaction with its support level could be seen which brings the price target to $90.
EOS/USD
From the start of July when the price of EOS reached $4.29 we have seen a decline of 16% measured to its lowest point today at $3.586. It is being traded slightly higher but like in the case of Litecoin a breakout was seen from the descending support level yesterday so the momentum is still strong and would be expected to continue moving the price further down.
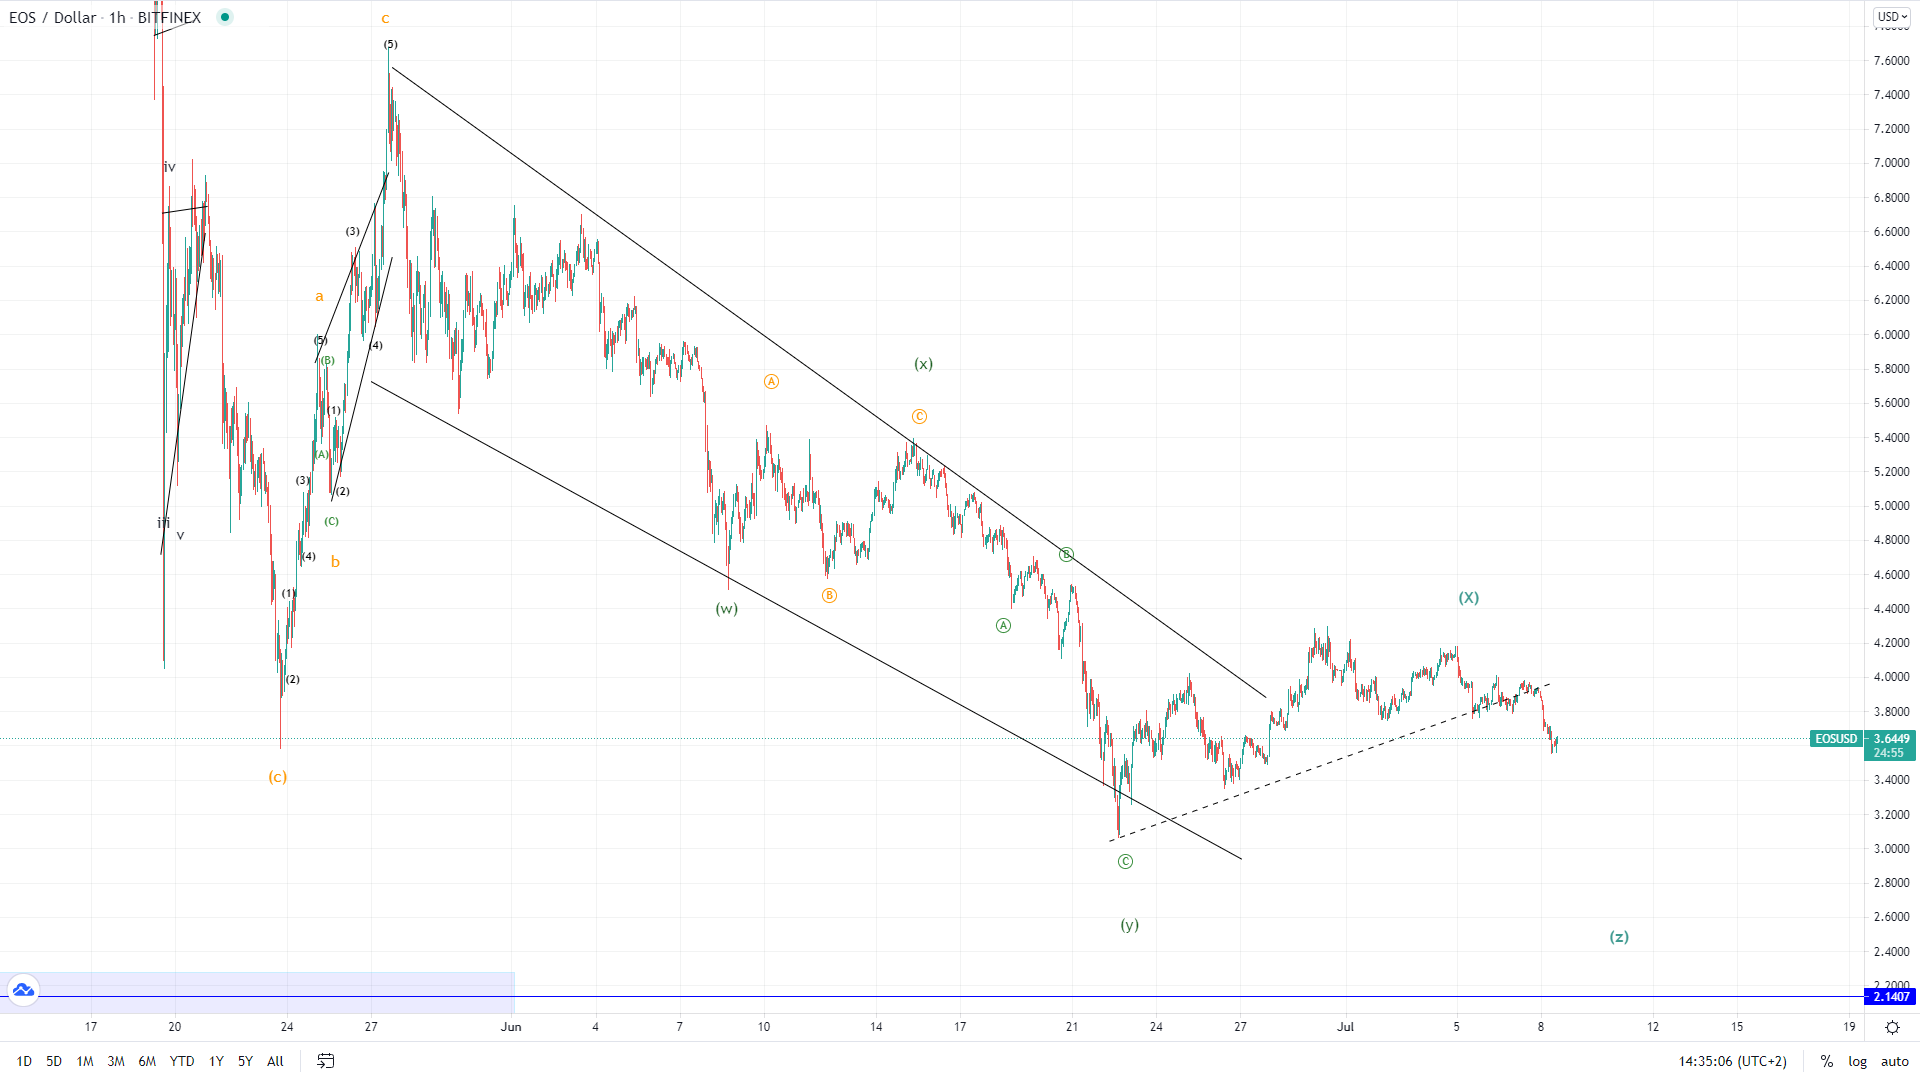
In a prior analysis, we have counted the structure from the 27th of May till the 22nd of June as a WXY correction with the recovery seen from there possibility being the start of an impulsive move to the upside. However, this has now been invalidated but the wave structure.
We have most likely seen the complex correction prolongation with the recovery from the 22nd being the second wave X. This is why now another lower low would be expected to the territory of $2.14 as the fifth Z wave.
This forecast represents FXOpen Markets Limited opinion only, it should not be construed as an offer, invitation or recommendation in respect to FXOpen Markets Limited products and services or as financial advice. Cryptocurrency CFDs are not available to trade in all jurisdictions.
FXOpen offers the world's most popular cryptocurrency CFDs*, including Bitcoin and Ethereum. Floating spreads, 1:2 leverage — at your service. Open your trading account now or learn more about crypto CFD trading with FXOpen.
*At FXOpen UK and FXOpen AU, Cryptocurrency CFDs are only available for trading by those clients categorised as Professional clients under FCA Rules and Professional clients under ASIC Rules respectively. They are not available for trading by Retail clients.
This article represents the opinion of the Companies operating under the FXOpen brand only. It is not to be construed as an offer, solicitation, or recommendation with respect to products and services provided by the Companies operating under the FXOpen brand, nor is it to be considered financial advice.
Latest articles

Weekly Market Wrap With Gary Thomson: S&P500, US Dollar, Gold Price, PEP Stocks
Get he latest scoop on the week's hottest headlines, all in one convenient video. Join Gary Thomson, the COO of FXOpen UK, as he breaks down the most significant news reports and shares his expert insights. Read the latest news

The Price of Silver Has Reached Its Highest Level in Over Three Years
As indicated by the XAG/USD chart today, the intraday price of silver reached $29.84 per ounce yesterday, while the previous yearly high on 12 April was $29.79. The last time this price was seen was in February

What Is the Wolfe Wave, and How Can You Trade It?
The Wolfe Waves is a powerful chart pattern recognised for analysing potential price reversals. Named after Bill Wolfe, who developed this formation through extensive trading practice, Wolfe Waves provide traders with a structured approach to anticipate market movements. In this