


FXOpen

LTC/USD
From Monday’s open at $43.46 the price of Litecoin has decreased by 16.8% as it came down to $36.153 at its lowest point yesterday. From yesterday’s low we have seen a spike to the upside which recovered the price by around 15.4% as the price came up to $41.7 at its highest today.
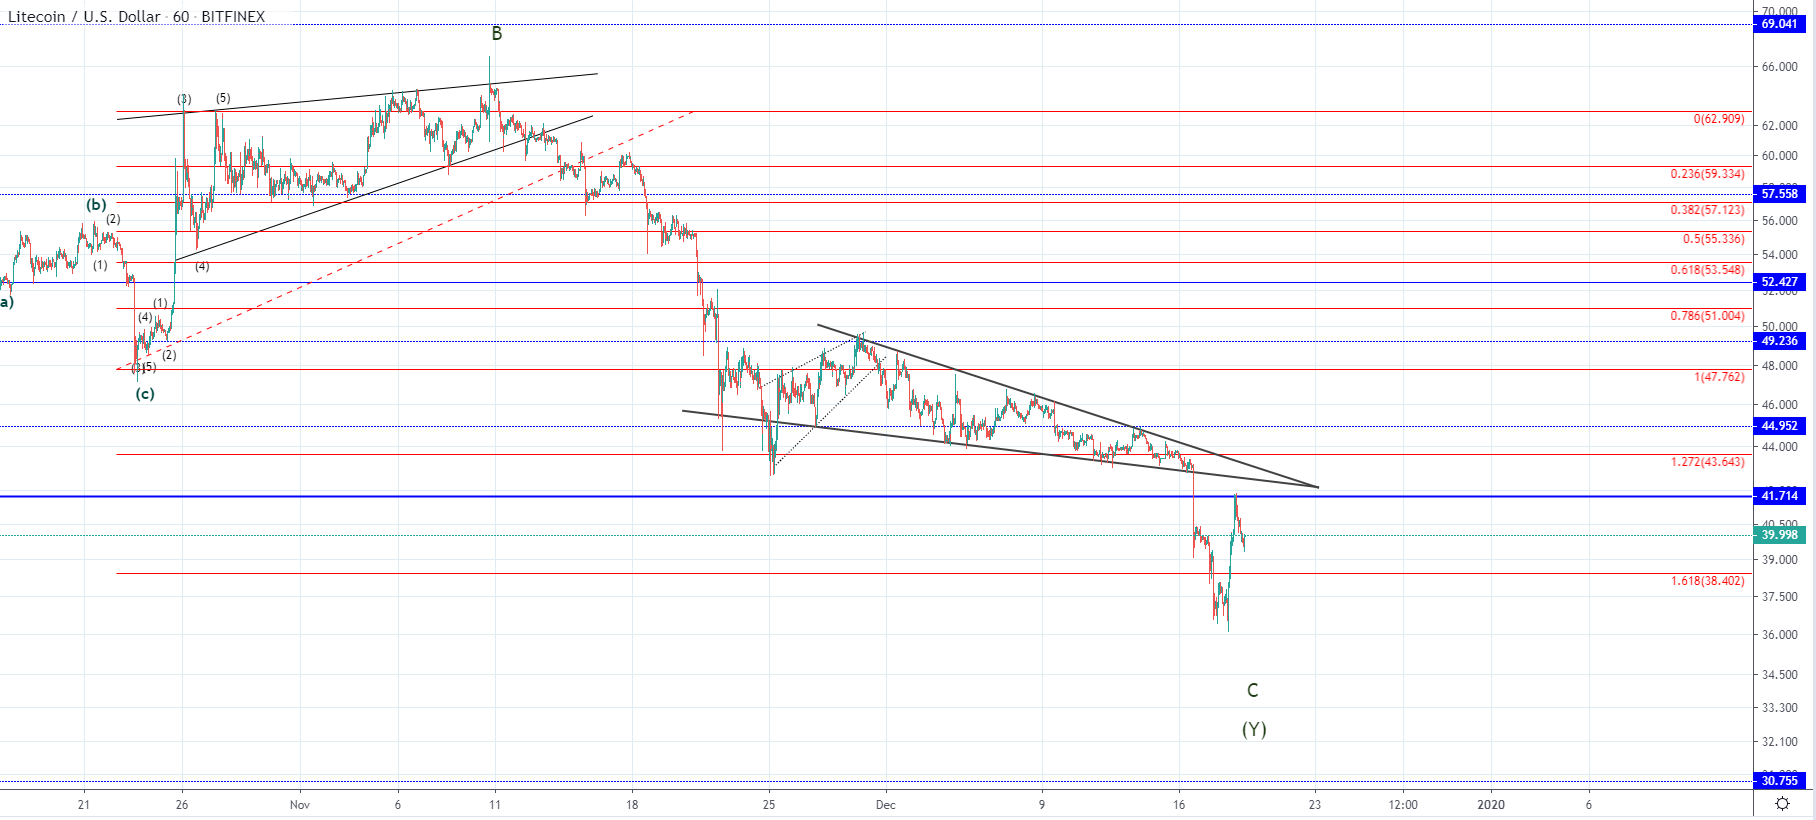 Looking on the hourly chart, you can see that the price broke out from the descending triangle with strong bearish momentum pushing the price below the significant horizontal level at $41.7. The recovery seen after, pushed the price to its vicinity and has retested it for resistance which was clearly there, as the interaction ended as a rejection.
This was presumed to be the 5th wave out of the higher degree C wave but was projected to end as an ending diagonal. This was invalidated as the price impulsively broke down from the diagonal meaning we could still be seeing further downside before the completion of the C wave with the triangle structure potentially only being the 2nd wave out of the lower degree count.
Today’s spike could be the start of the expected recovery after the C wave ended but it could also be corrective as the part of the same correction to the upside as the previous move to the upside. If we are seeing the start of the higher degree recovery the price is to continue moving to the upside above the currently provided resistance at $41.7 but if it falls again below 1.618 Fib level we could see further decrease for the price of Litecoin.
EOS/USD
From Monday’s high at $2.56 the price of EOS has decreased by 15.23% measured to the lowest point the price has been this week which is at $2.17 made yesterday. But the price started moving to the upside impulsively from yesterday’s low and came back to $2.511 which is an increased of 15.56%. Currently, the price is being traded at $2.46 and is consolidating.
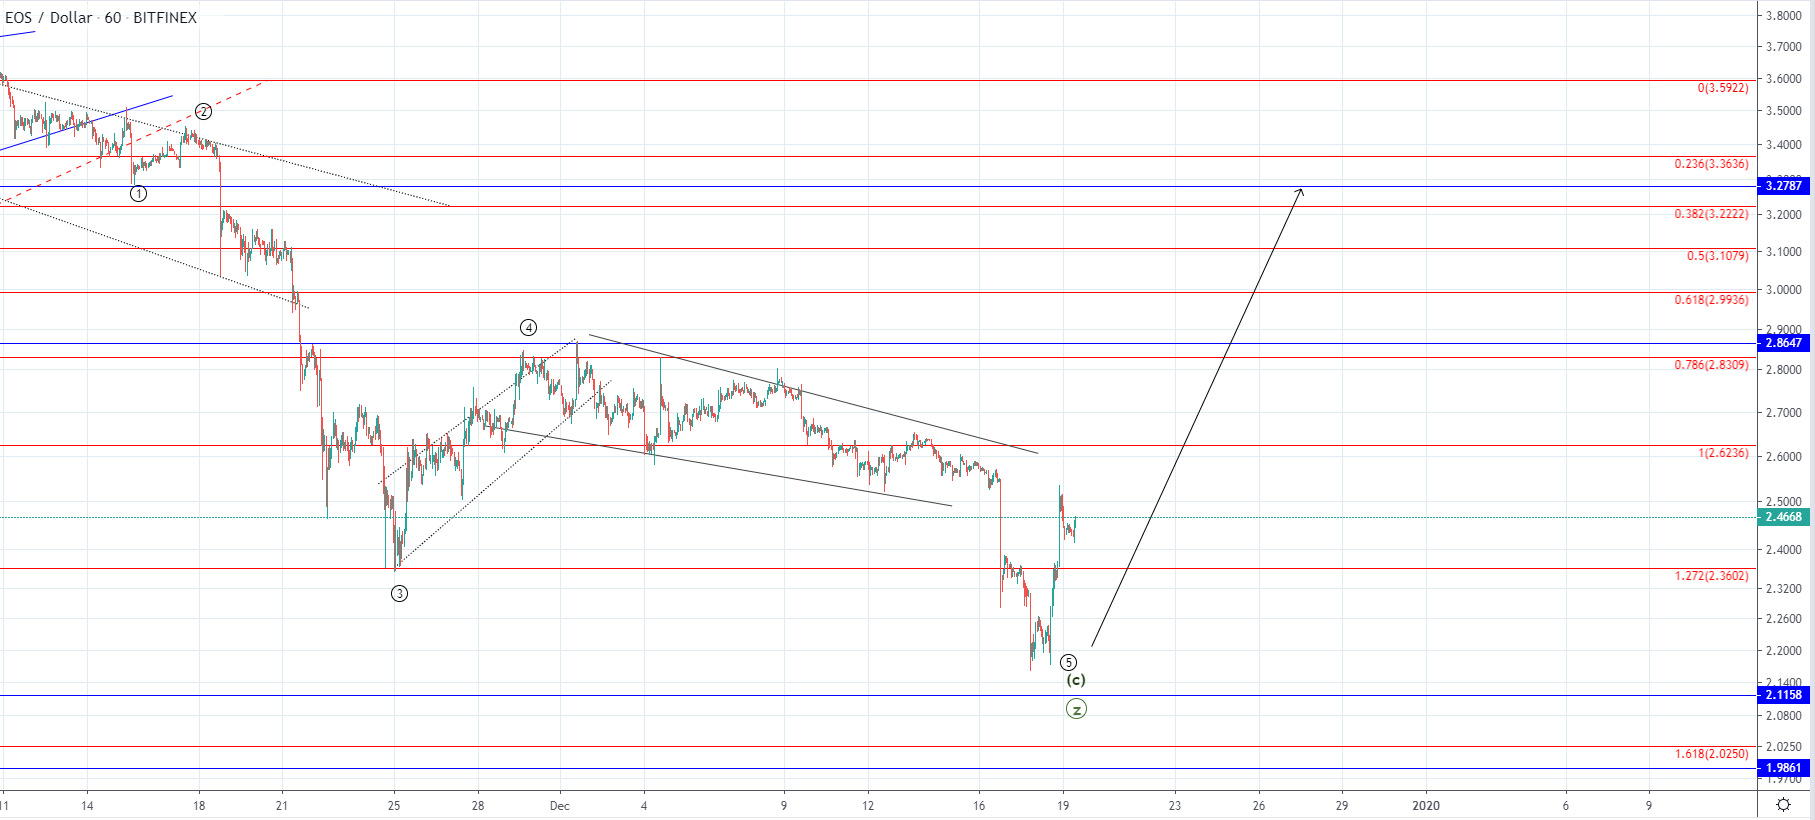
On the hourly chart, we can see that the price fell below the 1.272 Fibonacci level which was the prior low and presumed to be the ending point of the 3rd wave of a lower degree from a five-wave move to the downside which is considered a C wave of a higher degree. Like in the case of Litecoin we have seen a spike to the upside but in EOS’s case, the price hasn’t found resistance at the prior horizontal level and only made a minor retracement.
We could have seen the completion of the C wave and with it, the Z wave of a higher degree count in which case the spike was seen could be an early sign of the expected recovery. This is soon to be validated by the price momentum but if it continues moving above the $2.54 level it would most likely indicate that. If the price, however, starts decreasing from here it could indicate that the spike was corrective and should be viewed as the part of the same correction as the previous increase.
FXOpen offers the world's most popular cryptocurrency CFDs*, including Bitcoin and Ethereum. Floating spreads, 1:2 leverage — at your service. Open your trading account now or learn more about crypto CFD trading with FXOpen.
*At FXOpen UK and FXOpen AU, Cryptocurrency CFDs are only available for trading by those clients categorised as Professional clients under FCA Rules and Professional clients under ASIC Rules respectively. They are not available for trading by Retail clients.
This article represents the opinion of the Companies operating under the FXOpen brand only. It is not to be construed as an offer, solicitation, or recommendation with respect to products and services provided by the Companies operating under the FXOpen brand, nor is it to be considered financial advice.
Latest from Cryptocurrencies
Latest articles

Weekly Market Wrap With Gary Thomson: UK100, USD, GOLD, OIL
Get the latest scoop on the week's hottest headlines, all in one convenient video. Join Gary Thomson, the COO of FXOpen UK, as he breaks down the most significant news reports and shares his expert insights.
- UK100 Share Index Rises

What Is a Darvas Box Theory and How Does It Work in Trading?
The Darvas Box Theory, pioneered by Nicolas Darvas in the 1950s, has transcended its stock market origins to become a valuable tool for forex traders. This method leverages specific price movements and patterns, known as the Darvas Box, to track

NFLX Stock Price Falls Despite Subscriber Growth
Yesterday, after the close of the main trading session on the stock market, Netflix reported to investors for the 1st quarter of 2024.
The report turned out better than expected:
→ earnings per share: actual = USD 5.28, forecast = USD 4.