


FXOpen
LTC/USD
The price of Litecoin has been on a decline since the 10th of May when it reached $413 at its highest point. From there we have seen a decrease of 64.88% as it fell to $145 at its lowest point yesterday. We have seen a recovery taking place with the price currently being traded at $211 and is still in an upward trajectory.
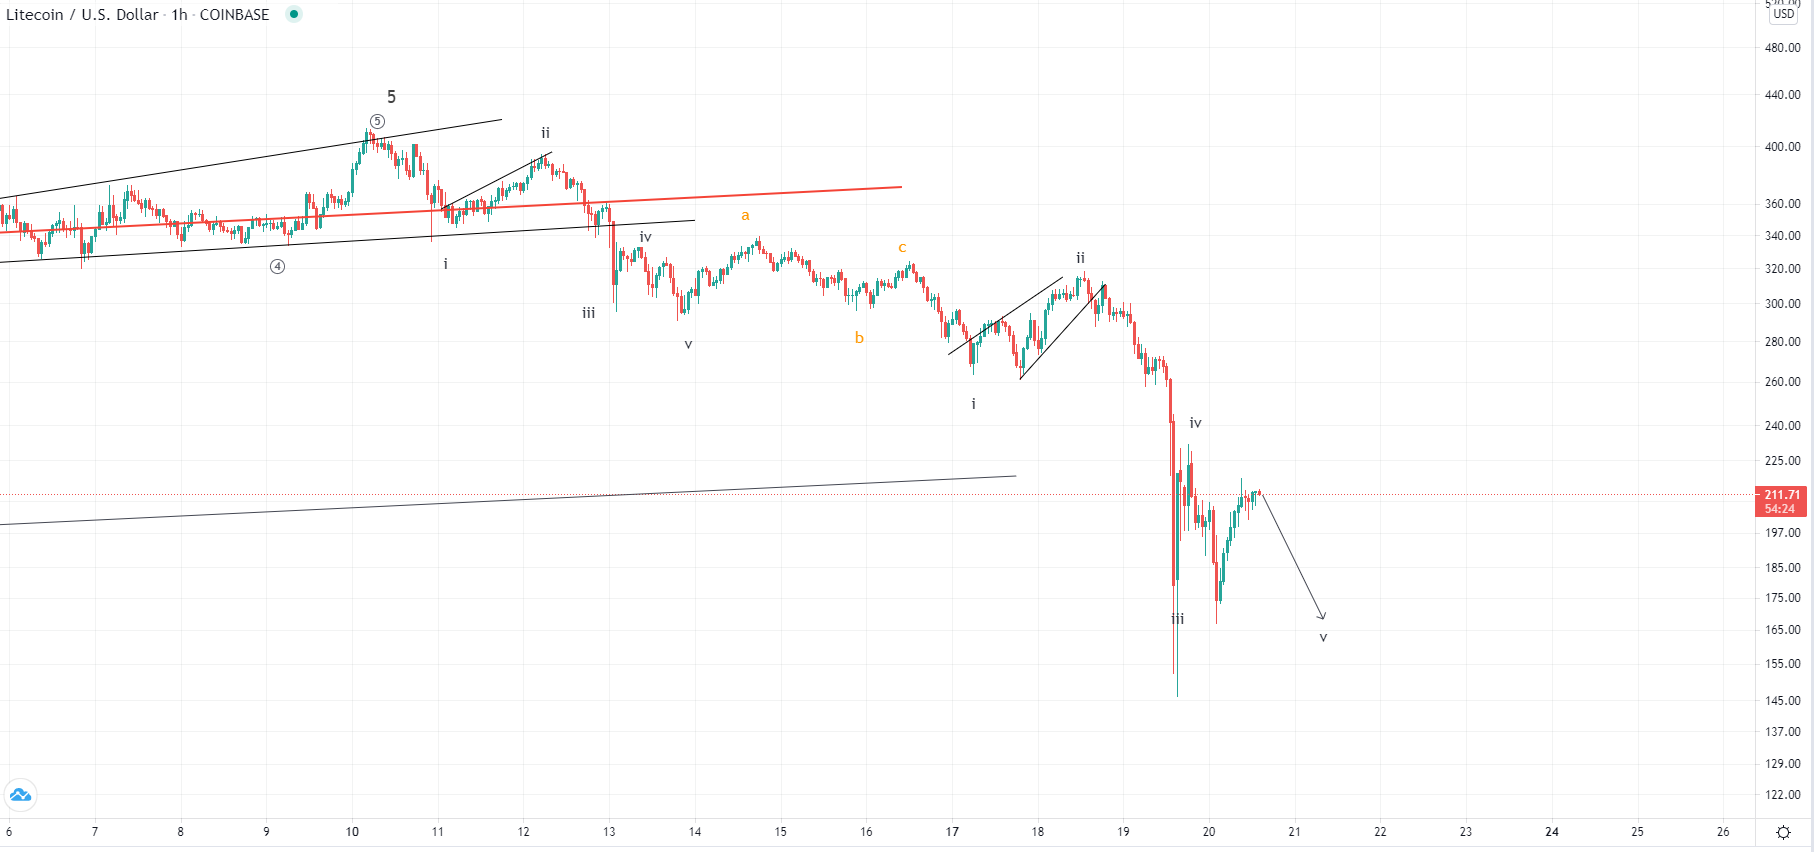
On the hourly chart, you can see that the price has made a lower low today, compared to yesterday’s candle close, and is now still above yesterday’s high. This is still a negative sign even though recovery has been seen. We could bee saw the 4th corrective wave out of the five-wave impulse to the downside from the 16th which is still in development. If this is true then the price would be headed downwards after this increase ends for another establishment of support around the $165 area.
In another move positive scenario the decrease ended with today’s recovery being the 1st sub-wave of the next five-wave impulse to the upside. Even so a retracement would be expected and first a surpassing of yesterday’s high so for the pullback that is expected to follow we can evaluate these possibilities.
EOS/USD
EOS has recovered by 29.3% from its yesterday’s low of around $5 as it made an increase to $6.6476 at its highest point today where it currently and is still going to the upside further.

Looking at the hourly chart you can see that the price has been in a downward trajectory from the 12th of May and now developed a three-wave move. It might have ended but the picture still shows a negative sentiment as the price is struggling to surpass yesterday’s high. Similarly like in the case of Litecoin we could either be seeing a 4th wave from the descending five-wave impulse or the start of the next impulse to the upside if the downfall ended on yesterday’s low.
Today we are going to see which scenario is in play as if the price manages to surpass the prior high and lands on a higher low on the next move to the downside it would validate the positive scenario. But if however, we see a rejection at the current levels and the price goes below the $5.2 area it would indicate that a lower low is move likely before the completion of the descending move from the 12th.
This forecast represents FXOpen Markets Limited opinion only, it should not be construed as an offer, invitation or recommendation in respect to FXOpen Markets Limited products and services or as financial advice. Cryptocurrency CFDs are not available to trade in all jurisdictions.
FXOpen offers the world's most popular cryptocurrency CFDs*, including Bitcoin and Ethereum. Floating spreads, 1:2 leverage — at your service. Open your trading account now or learn more about crypto CFD trading with FXOpen.
*At FXOpen UK and FXOpen AU, Cryptocurrency CFDs are only available for trading by those clients categorised as Professional clients under FCA Rules and Professional clients under ASIC Rules respectively. They are not available for trading by Retail clients.
This article represents the opinion of the Companies operating under the FXOpen brand only. It is not to be construed as an offer, solicitation, or recommendation with respect to products and services provided by the Companies operating under the FXOpen brand, nor is it to be considered financial advice.
Latest articles

Anchored VWAP and How You Can Use It in Forex Trading
In the world of forex trading, understanding the nuanced tools at your disposal can significantly enhance decision-making processes. One such sophisticated tool is the Anchored Volume-Weighted Average Price (Anchored VWAP), which refines the standard VWAP by allowing traders to set

META Share Price Collapses after Publication of Quarterly Report
Just yesterday, META's stock price closed at USD 493.50, up approximately 40% since the start of 2024 and up nearly 300% since the start of 2023.
However, following the release of Meta's quarterly report, its shares plummeted to USD

USD/JPY Analysis: The Rate Exceeds The Level of 155 Yen Per US Dollar
Today, the price of USD/JPY once again renewed its 34-year high, exceeding the level of 155 yen per dollar, which put pressure on the current authorities.
According to Reuters, officials are trying to maintain calm in the market.
"We