


FXOpen

LTC/USD
The price of Litecoin has been rising since last week and came up to its previous high at $244 on the 6th of April. From there we have seen a decline of 13.26% as it came down to $211.62. Currently, it is being traded at around $220.9 as a minor recovery has been made but the price has been moving to the downside again.
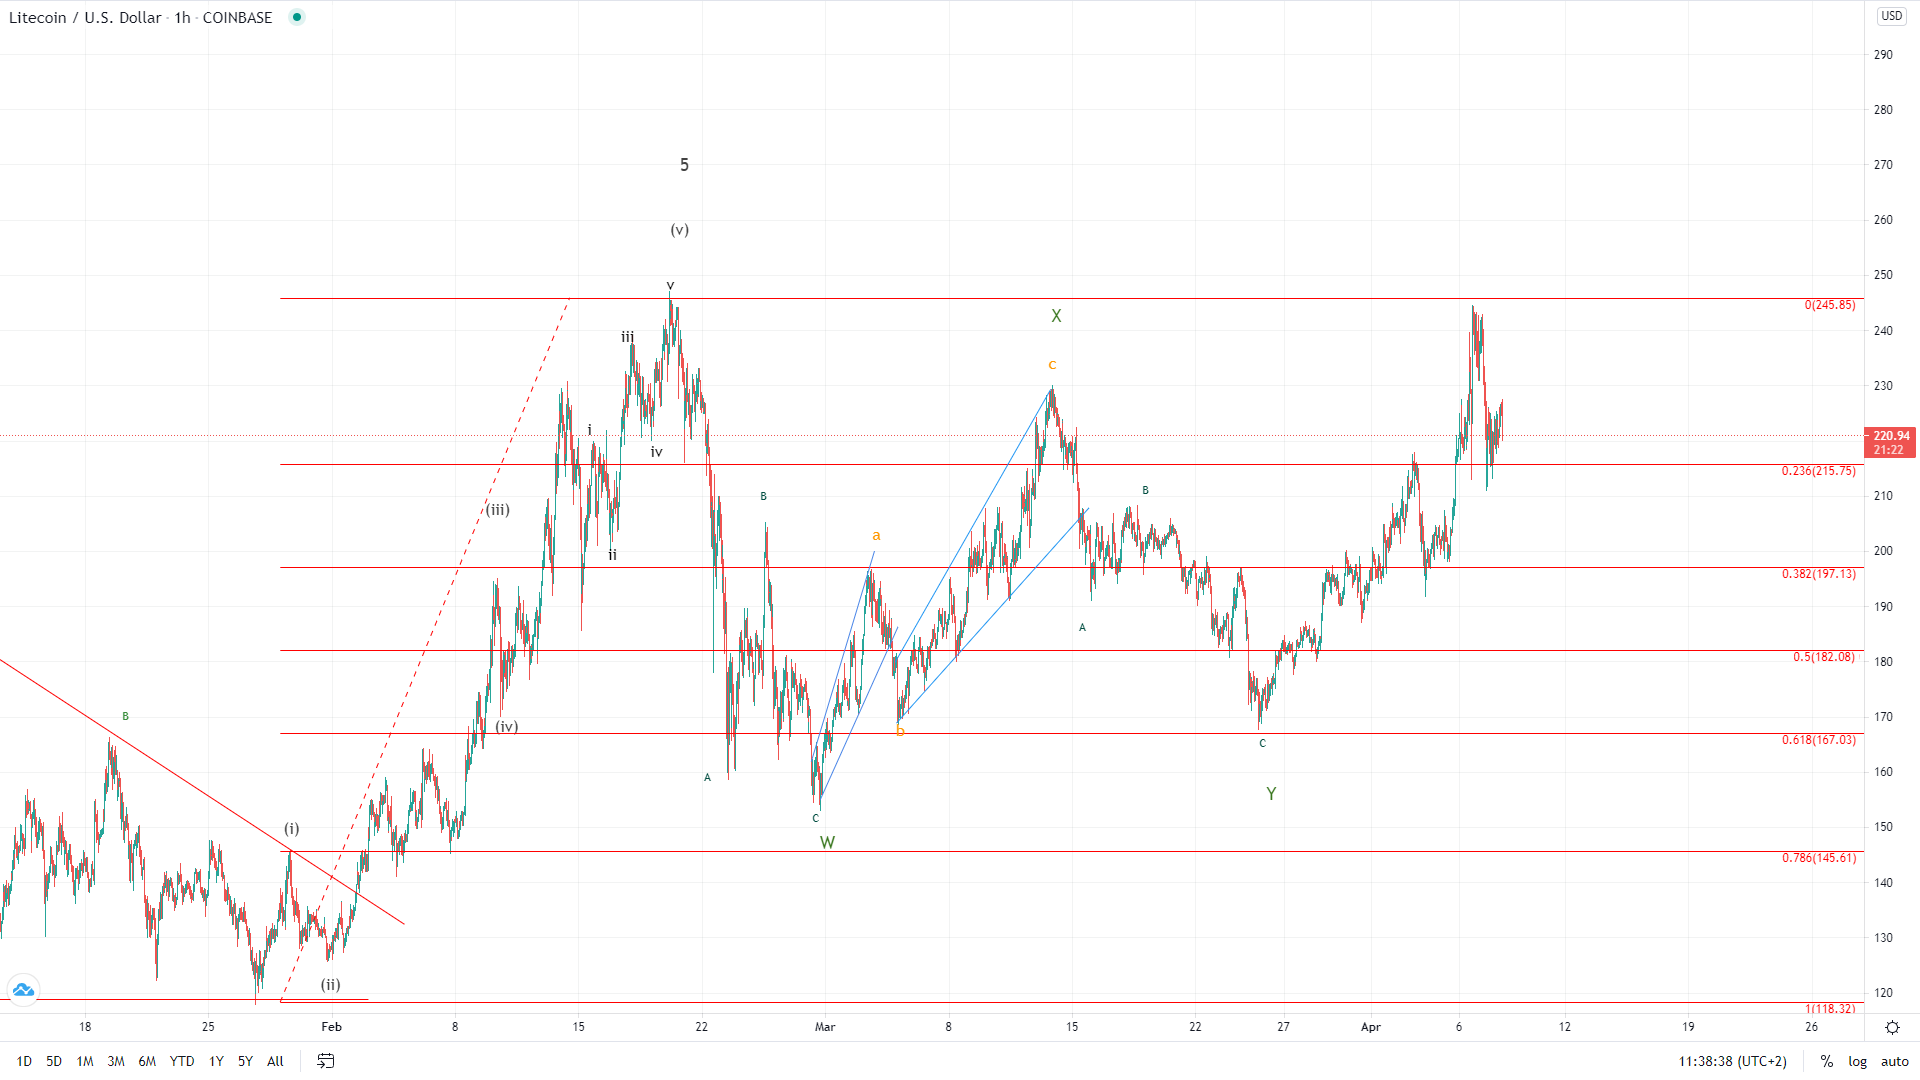
On the hourly chart, you can see that the price of Litecoin was on the rise since the 25th of March when it fell down to the 0.618 Fibonacci level. This was at first expected as a corrective 4th wave from the descending impulse wave but as it continued increasing from there above the 0.382 FIb level the count was invalidated which implied that previously we have seen a three-wave correction.
If the previosly seen descending move ended as the higher degree WXY correction then from the 25th of March we have seen the start of the next impulsive move being its first wave. No retracement back to the 0.382 Fib level could be expected as the second sub-wave of the five-wave impulse to the upside from which the price of Litecoin would be set to continue its upward trajectory. However, first, we need to see the establishment of support and the validation of the count so from the momentum and the depth of the expected descending move we are going to reevaluate this possibility.
EOS/USD
The price of EOS has been on a downfall from yesterday and came down from $7 to $5.72 at its lowest point today which was a decrease of 18.17%. We have seen a minor recovery to $6.23 but again the price started moving to the downside and is currently back below the $6 mark.

Looking at the hourly chart, you can see that the price made a higher high compared to the one made in February. This rise was made in an impulsive manner and came after a breakout to the downside from the ascending channel which was the dominant chart pattern in March. As we have seen strong upside movement this could be interpreted as the part of the next impulse wave to the upside out of which the rise that ended yesterday was its 3rd wave and the ascending channel made in March its 1st.
In that case, we are now seeing the development of the 4th corrective wave which is set to make a retest potentially of the prior high for support after further upside continuation which would be the 5th wave from the assumed impulse. This 4t wave count potentially end around $5 but it is still unclear where the price could find support which is why there is still uncertanty.
This forecast represents FXOpen Markets Limited opinion only, it should not be construed as an offer, invitation or recommendation in respect to FXOpen Markets Limited products and services or as financial advice. Cryptocurrency CFDs are not available to trade in all jurisdictions.
FXOpen offers the world's most popular cryptocurrency CFDs*, including Bitcoin and Ethereum. Floating spreads, 1:2 leverage — at your service. Open your trading account now or learn more about crypto CFD trading with FXOpen.
*At FXOpen UK and FXOpen AU, Cryptocurrency CFDs are only available for trading by those clients categorised as Professional clients under FCA Rules and Professional clients under ASIC Rules respectively. They are not available for trading by Retail clients.
This article represents the opinion of the Companies operating under the FXOpen brand only. It is not to be construed as an offer, solicitation, or recommendation with respect to products and services provided by the Companies operating under the FXOpen brand, nor is it to be considered financial advice.
Latest from Cryptocurrencies
Latest articles

What Order Imbalance Is and How To Use It in a Trading Strategy
Understanding the nuances of order imbalances is key for traders looking to navigate the ebb and flow of asset prices. Order imbalances provide a clear window into the supply and demand dynamics at play, offering strategic insights. This article delves

XAU/USD Gold Price Reaches an Important Resistance Zone
The XAU/USD gold chart today indicates that the historical record price of the metal is above USD 2,400 per ounce.
In addition to fears of a new round of inflation due to rising commodity prices, geopolitical tensions are

What Is a Break of Structure and How Can You Trade It?
In the ever-evolving world of Smart Money Concept (SMC) trading, a nuanced understanding of market dynamics is indispensable. This article explores the concept of Break of Structure (BOS), how to identify it, and its implications for trading strategies, setting traders