


FXOpen

LTC/USD
The price of Litecoin has been on the rise since the start of the month and came up from $154 to $197.24 at its highest point so far which was an increase of 28%. Since yesterday’s high we have seen a pullback to the $182 level above which it is currently being traded.
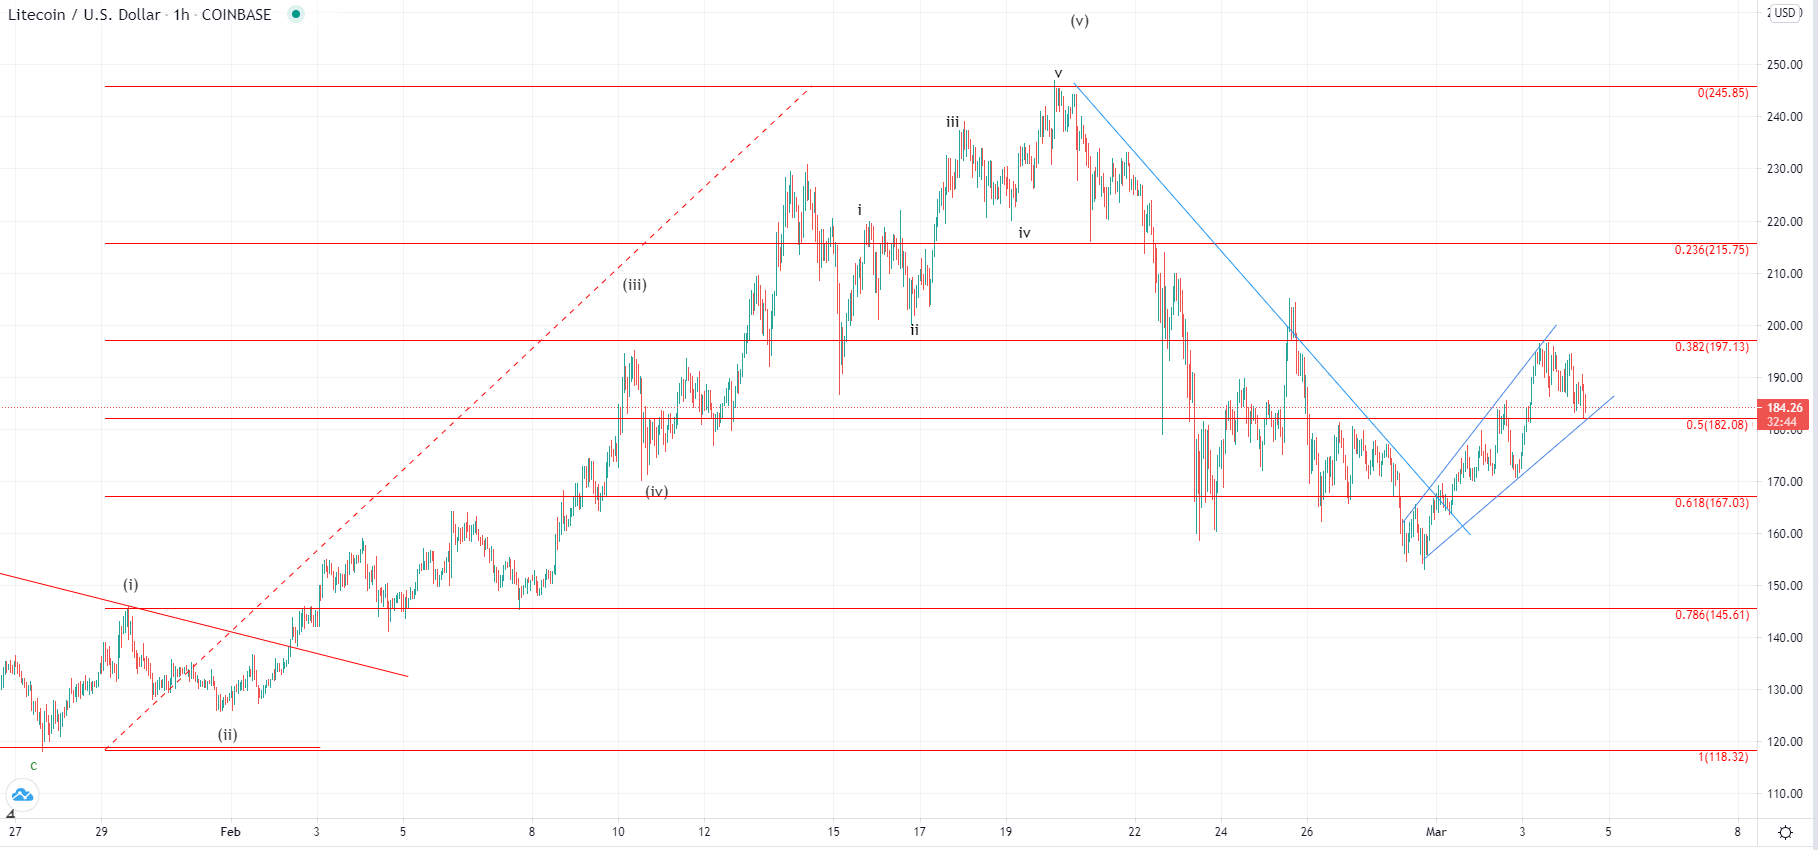
On the hourly chart, you can see that the price of Litecoin is making an interaction with the 0.5 Fib level measured from the 27th of January until the 20th of February which was the five-wave impulse to the upside that developed after a prolonged correction in January. The price made another minor breakout from the start of March from the descending trendline and is now inside another ascending channel.
If the previous upside impulse was the next five-wave impulse to the upside, the price has made a corrective decrease afterward. This would bring the current rise as the next sub-wave of the upward impusle that is set to exceed February’s high of $246. But another possibility could be that the higher degree impulse ended in February with the seen five-wave move in which case the currently seen rise is the 2nd sub-wave of the higher degree correction. This is why now depending on the wave structure behind the move we are going to see which scenario is in play.
If the price makes another three-wave move it would mean that the rise since the start of the month is corrective, but if it continues moving to the upside in a five-wave manner that would be an early indication that we are going to see a further uptrend continuation and new yearly highs for the price of Litecoin above the February’s one.
EOS/USD
Similarly like in the case of Litecoin, the price of EOS has been on the rise since the start of the month and made an increase of 21.4%, coming from $3.31 to just slightly above $4 at its highest point yesterday. Currently, it is being traded at $3.779 as a minor pullback was made.

Looking at the hourly chart, we can see that the price is at the uptrend support level from the ascending channel that started developing at the start of the month. Now we are going to see from the interaction if the support is going to be present or are we going to see a breakout to the downside. The previous downfall appears to have ended as the higher degree ABC correction which is why the uptrend continuation looks more likely at this point, but if the price continues moving below the currently interacted support level that could mean that further lows are ahead.
This forecast represents FXOpen Markets Limited opinion only, it should not be construed as an offer, invitation or recommendation in respect to FXOpen Markets Limited products and services or as financial advice.
Cryptocurrency CFDs are not available to trade in all jurisdictions.
FXOpen offers the world's most popular cryptocurrency CFDs*, including Bitcoin and Ethereum. Floating spreads, 1:2 leverage — at your service. Open your trading account now or learn more about crypto CFD trading with FXOpen.
*At FXOpen UK and FXOpen AU, Cryptocurrency CFDs are only available for trading by those clients categorised as Professional clients under FCA Rules and Professional clients under ASIC Rules respectively. They are not available for trading by Retail clients.
This article represents the opinion of the Companies operating under the FXOpen brand only. It is not to be construed as an offer, solicitation, or recommendation with respect to products and services provided by the Companies operating under the FXOpen brand, nor is it to be considered financial advice.
Latest articles

Anchored VWAP and How You Can Use It in Forex Trading
In the world of forex trading, understanding the nuanced tools at your disposal can significantly enhance decision-making processes. One such sophisticated tool is the Anchored Volume-Weighted Average Price (Anchored VWAP), which refines the standard VWAP by allowing traders to set

META Share Price Collapses after Publication of Quarterly Report
Just yesterday, META's stock price closed at USD 493.50, up approximately 40% since the start of 2024 and up nearly 300% since the start of 2023.
However, following the release of Meta's quarterly report, its shares plummeted to USD

USD/JPY Analysis: The Rate Exceeds The Level of 155 Yen Per US Dollar
Today, the price of USD/JPY once again renewed its 34-year high, exceeding the level of 155 yen per dollar, which put pressure on the current authorities.
According to Reuters, officials are trying to maintain calm in the market.
"We