


FXOpen
LTC/USD
The price of Litecoin has been on the rise from the 25th when it was being traded at $169. We have seen an increase of 18.7% as the price came up to $200 at its highest point today. Currently it is being traded slightly lower but is still in an upward trajectory overall.
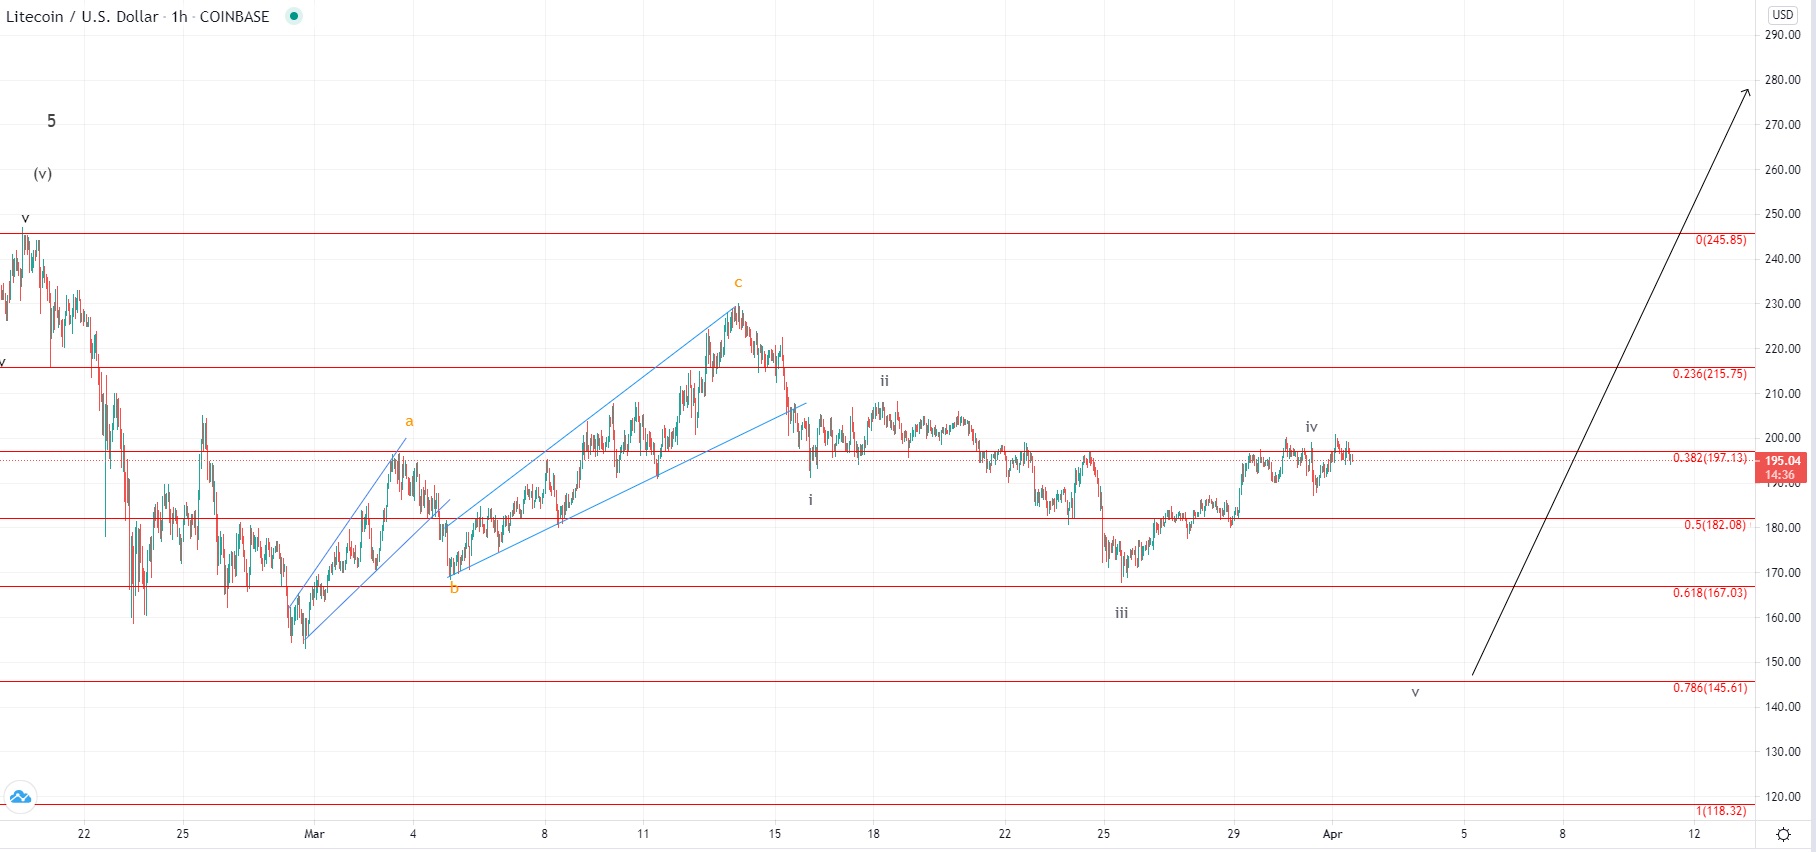
Looking at the hourly chart, we can see that the price came up to the 0.382 Fibonacci level and made an attempt to break out above it but failed to do so. The first attempt was made on the 29th from which we have seen some sideways movement below the level before finally another attempt was made today. The price would now be expected to make pullback as the 3rd attempt for a breakout failed, but we haven’t seen a rejection just yet.
If from the 25th we have seen the development of the 4th corrective wave out of the five-wave impulse to the downside now the price would be starting the development of its 5th wave to the downside which would be set to achieve a lower low compared to the 25th one. However, there could be a possibility that the decrease ended as a three-wave move as the part of the higher degree complex correction count, in which case the ascending move would be the first sub-wave of the next starting impulse to the upside.
In either way, we are going to see from the interaction with the 0.382 Fib level what would be the scenario, as if it manages to go above it, it would enter the territory of the 1st wave and invalidated the possibility of a lower low.
EOS/USD
From the 25th of March when the price of EOS was being traded at $3.6 we have seen an increase of 42% as it came up to $4.9 at its highest point today. Now it is sitting at $4.78 as it is consolidating after an impulsive rise.
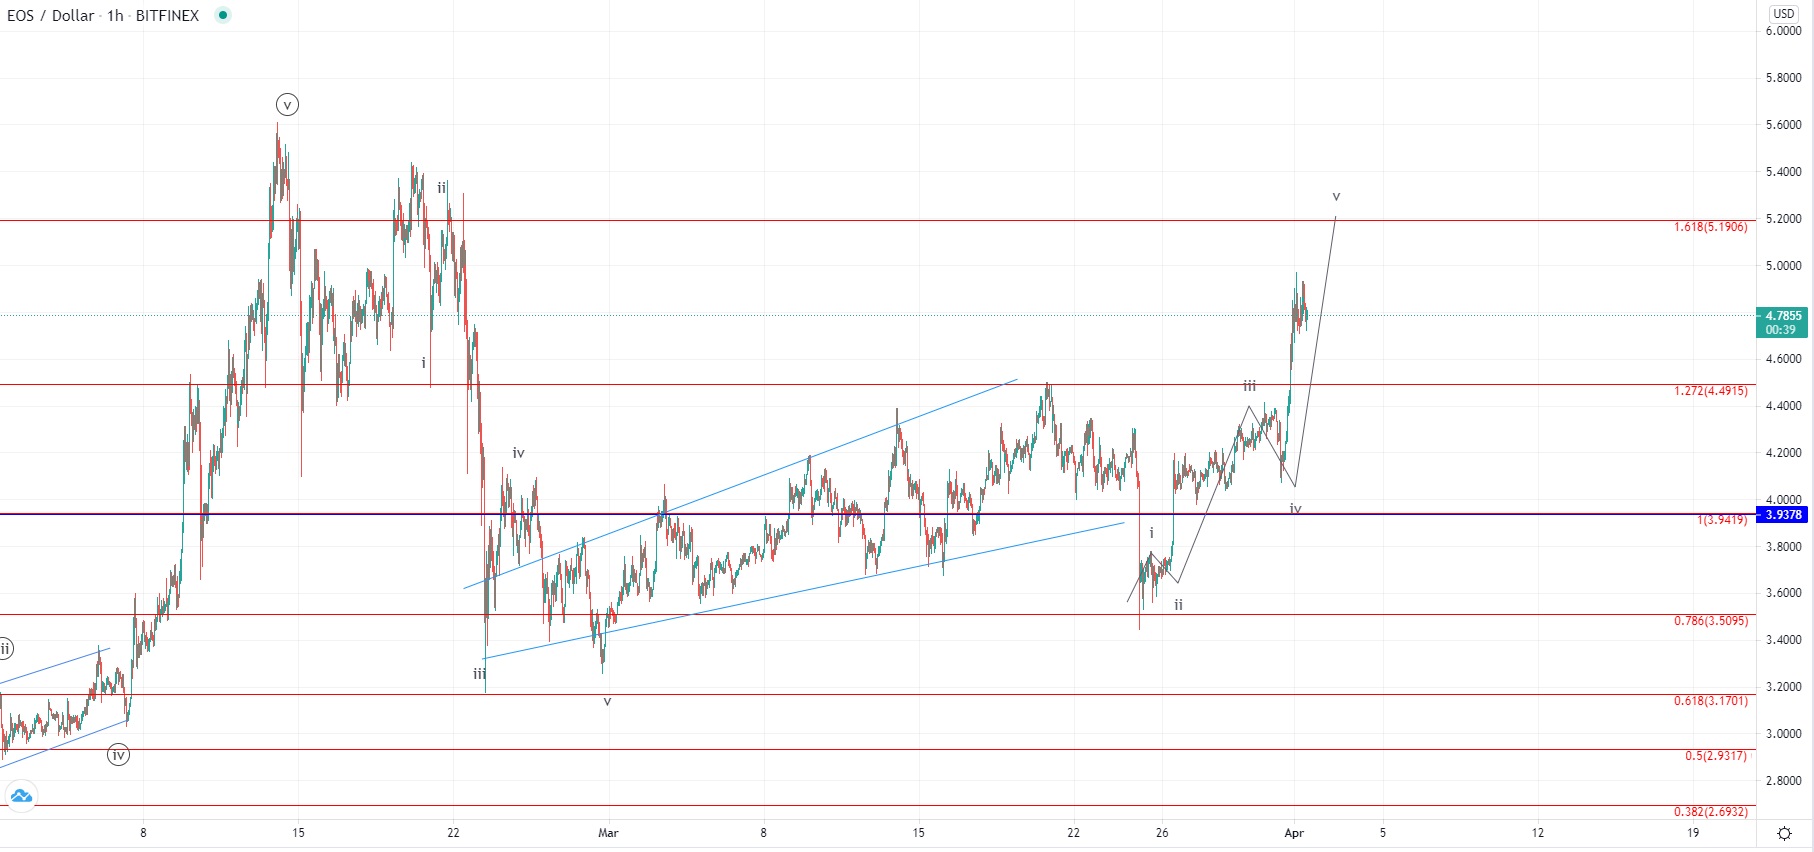
On the hourly chart, we can see that the price made a five-wave impulse to the upside from the 25th which would be the next wave to the upside after the correction from the 14th of February. The ascending channel which was forming prior could have been the corrective wave with a move to the downside made after a breakout being the end of the corrective move from the higher degree count.
But now as we have seen bullish price action this means that the ascending channel was most likely the first sub-wave of the higher degree impulse, making it a leading diagonal. Further upside movement would be expected for the price of EOS and likely interaction with February’s high at $5.1
This forecast represents FXOpen Markets Limited opinion only, it should not be construed as an offer, invitation or recommendation in respect to FXOpen Markets Limited products and services or as financial advice. Cryptocurrency CFDs are not available to trade in all jurisdictions.
FXOpen offers the world's most popular cryptocurrency CFDs*, including Bitcoin and Ethereum. Floating spreads, 1:2 leverage — at your service. Open your trading account now or learn more about crypto CFD trading with FXOpen.
*At FXOpen UK and FXOpen AU, Cryptocurrency CFDs are only available for trading by those clients categorised as Professional clients under FCA Rules and Professional clients under ASIC Rules respectively. They are not available for trading by Retail clients.
This article represents the opinion of the Companies operating under the FXOpen brand only. It is not to be construed as an offer, solicitation, or recommendation with respect to products and services provided by the Companies operating under the FXOpen brand, nor is it to be considered financial advice.
Latest articles

Anchored VWAP and How You Can Use It in Forex Trading
In the world of forex trading, understanding the nuanced tools at your disposal can significantly enhance decision-making processes. One such sophisticated tool is the Anchored Volume-Weighted Average Price (Anchored VWAP), which refines the standard VWAP by allowing traders to set

META Share Price Collapses after Publication of Quarterly Report
Just yesterday, META's stock price closed at USD 493.50, up approximately 40% since the start of 2024 and up nearly 300% since the start of 2023.
However, following the release of Meta's quarterly report, its shares plummeted to USD

USD/JPY Analysis: The Rate Exceeds The Level of 155 Yen Per US Dollar
Today, the price of USD/JPY once again renewed its 34-year high, exceeding the level of 155 yen per dollar, which put pressure on the current authorities.
According to Reuters, officials are trying to maintain calm in the market.
"We