


FXOpen

LTC/USD
From Monday’s open at $54.64 the price of Litecoin has increased by 5.34% at its highest point of the week made on Tuesday when the price retested the $57.558 level which was broken on the way down. Currently, the price is being traded slightly lower at around $55.72 as it was mostly been moving sideways since the start of the week.
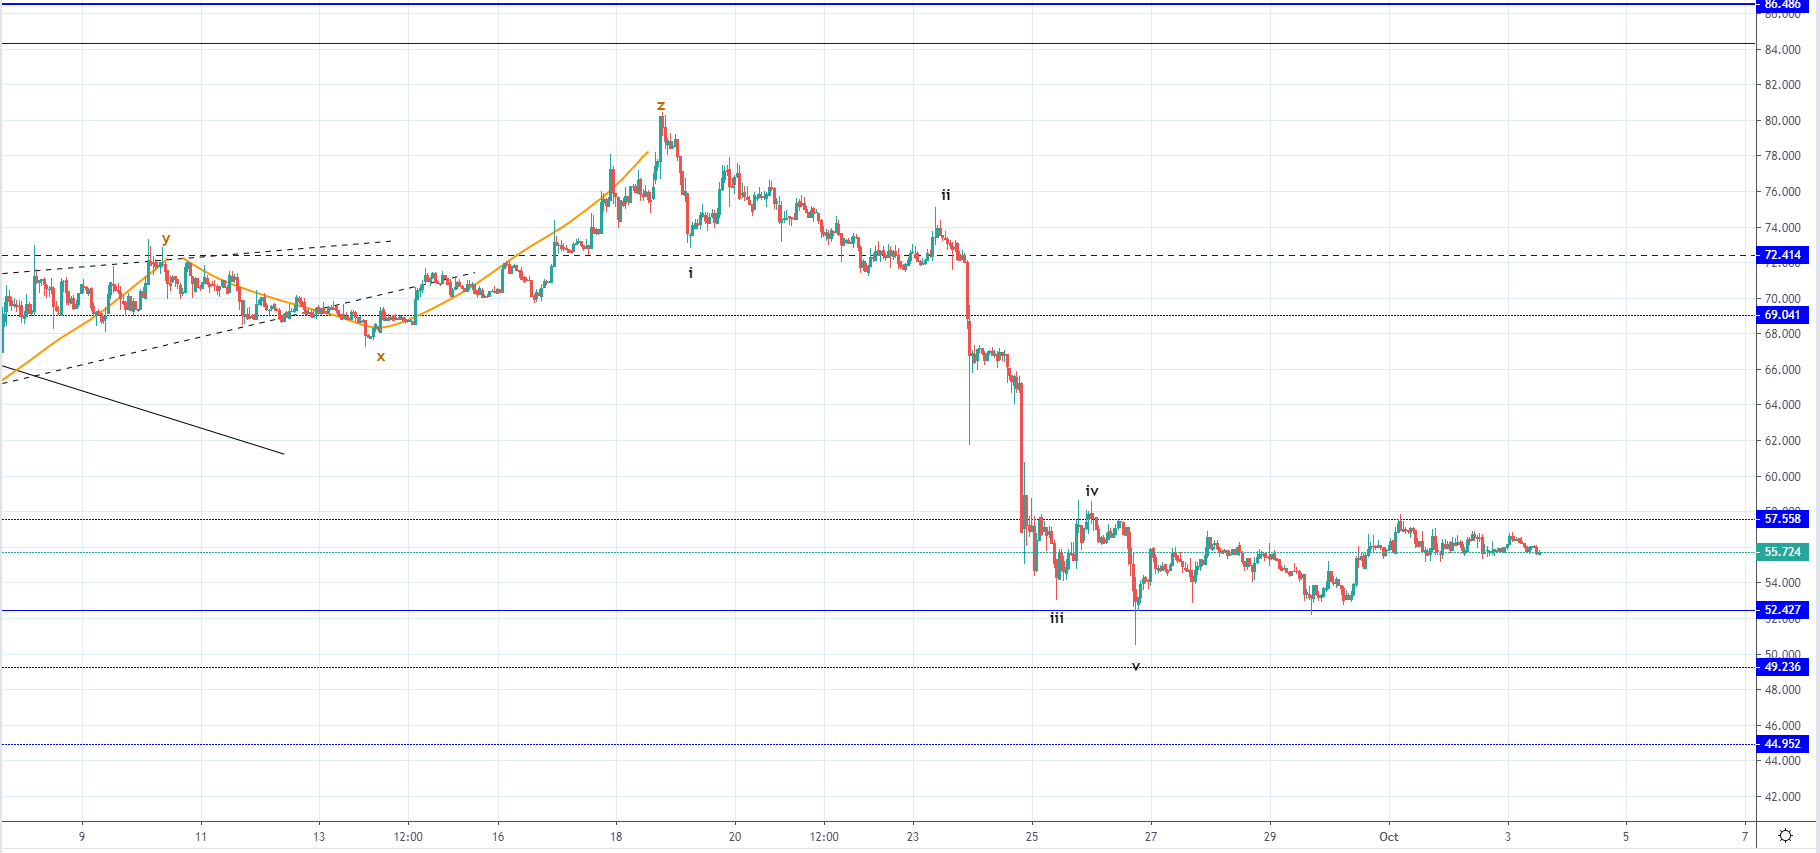 Looking at the hourly chart, you can see that the price of Litecoin most likely ended its five-wave move to the downside on the $52.427 horizontal level which is a major pivot level and was considered as the median line of the support zone with the $57.558 being its upper level. As the price came down inside this support range we are seeing the price retesting the levels before the next decisive move.
The next move that is likely to play out could be the start of a recovery as the price fell down to the significant horizontal level and found support there but since the bearish momentum was strong this could be interpreted as consolidation before the further downfall. If the price manages to increase above the $57.55 level and stays above it, the likelihood of the recovery commencing would increase but if the price gets rejected at the current retest and starts moving below the $52.42 level the possibility of the downtrend continuation would look more likely.
EOS/USD
The price of EOS has increased from Monday’s low at $2.7336 to $3.1335 on the next day which was an increase of 14.73% but from there decreased again and is currently being traded at $2.9584.
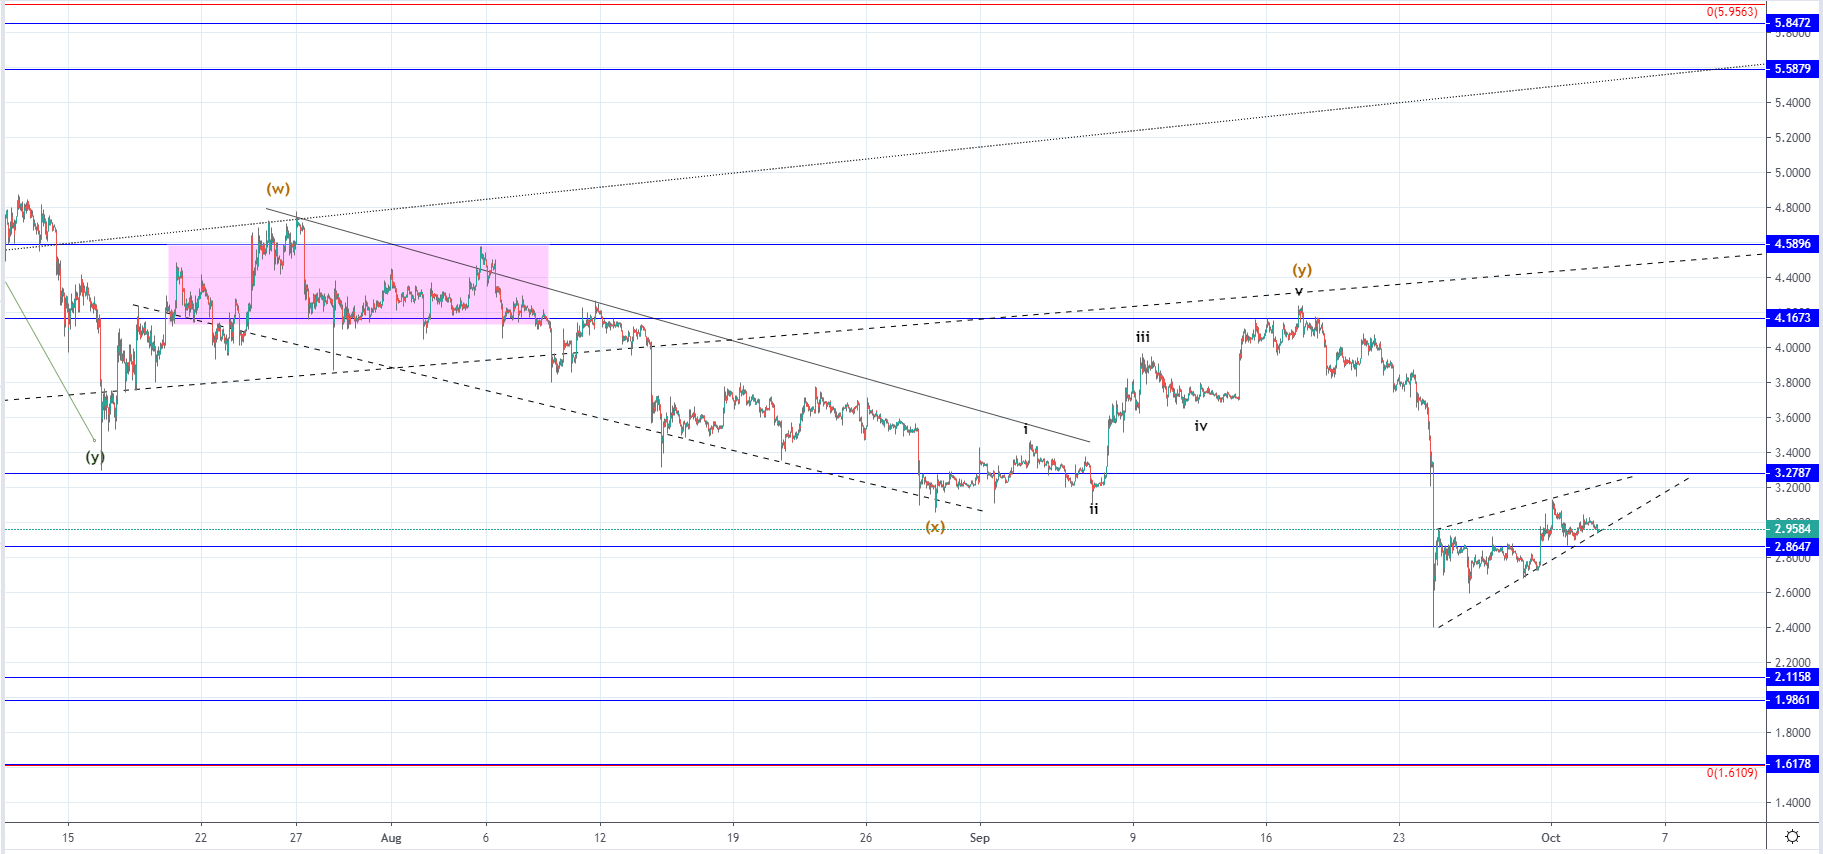 On the hourly chart, you can see that the price fell steeply with strong bearish momentum prior to the formation of this ascending triangle and spiked to $2.4 at its lowest point but since then managed to recover above the significant horizontal level at $2.86 which serves as support. This recovery might continue to the upper horizontal level at $3.2787 as a retest of resistance as the level was pierced on the way down.
The price is currently retesting the $2.86 level for support as well as the ascending support level from the still unconfirmed triangle which is why if the price finds support there we are to see further increase. But if the price falls below the $2.86 level it would mean that a minor breakout has been made with the price likely continuing its downside trajectory. If we have seen the completion of the WXY to the upside from the 16th of July till the 17th of September the downside move that played out could be the first wave out of the next downtrend move with the ascending triangle being its second which means that a third would start developing soon to the downside.
FXOpen offers the world's most popular cryptocurrency CFDs*, including Bitcoin and Ethereum. Floating spreads, 1:2 leverage — at your service. Open your trading account now or learn more about crypto CFD trading with FXOpen.
*At FXOpen UK and FXOpen AU, Cryptocurrency CFDs are only available for trading by those clients categorised as Professional clients under FCA Rules and Professional clients under ASIC Rules respectively. They are not available for trading by Retail clients.
This article represents the opinion of the Companies operating under the FXOpen brand only. It is not to be construed as an offer, solicitation, or recommendation with respect to products and services provided by the Companies operating under the FXOpen brand, nor is it to be considered financial advice.
Latest articles

Anchored VWAP and How You Can Use It in Forex Trading
In the world of forex trading, understanding the nuanced tools at your disposal can significantly enhance decision-making processes. One such sophisticated tool is the Anchored Volume-Weighted Average Price (Anchored VWAP), which refines the standard VWAP by allowing traders to set

META Share Price Collapses after Publication of Quarterly Report
Just yesterday, META's stock price closed at USD 493.50, up approximately 40% since the start of 2024 and up nearly 300% since the start of 2023.
However, following the release of Meta's quarterly report, its shares plummeted to USD

USD/JPY Analysis: The Rate Exceeds The Level of 155 Yen Per US Dollar
Today, the price of USD/JPY once again renewed its 34-year high, exceeding the level of 155 yen per dollar, which put pressure on the current authorities.
According to Reuters, officials are trying to maintain calm in the market.
"We