


FXOpen

LTC/USD
From last Thursday when the price of Litecoin was sitting at $41 we have seen an increase of 23.42% measured to its highest point today at $50.63. The price is being traded slightly lower and is still in an upward trajectory.
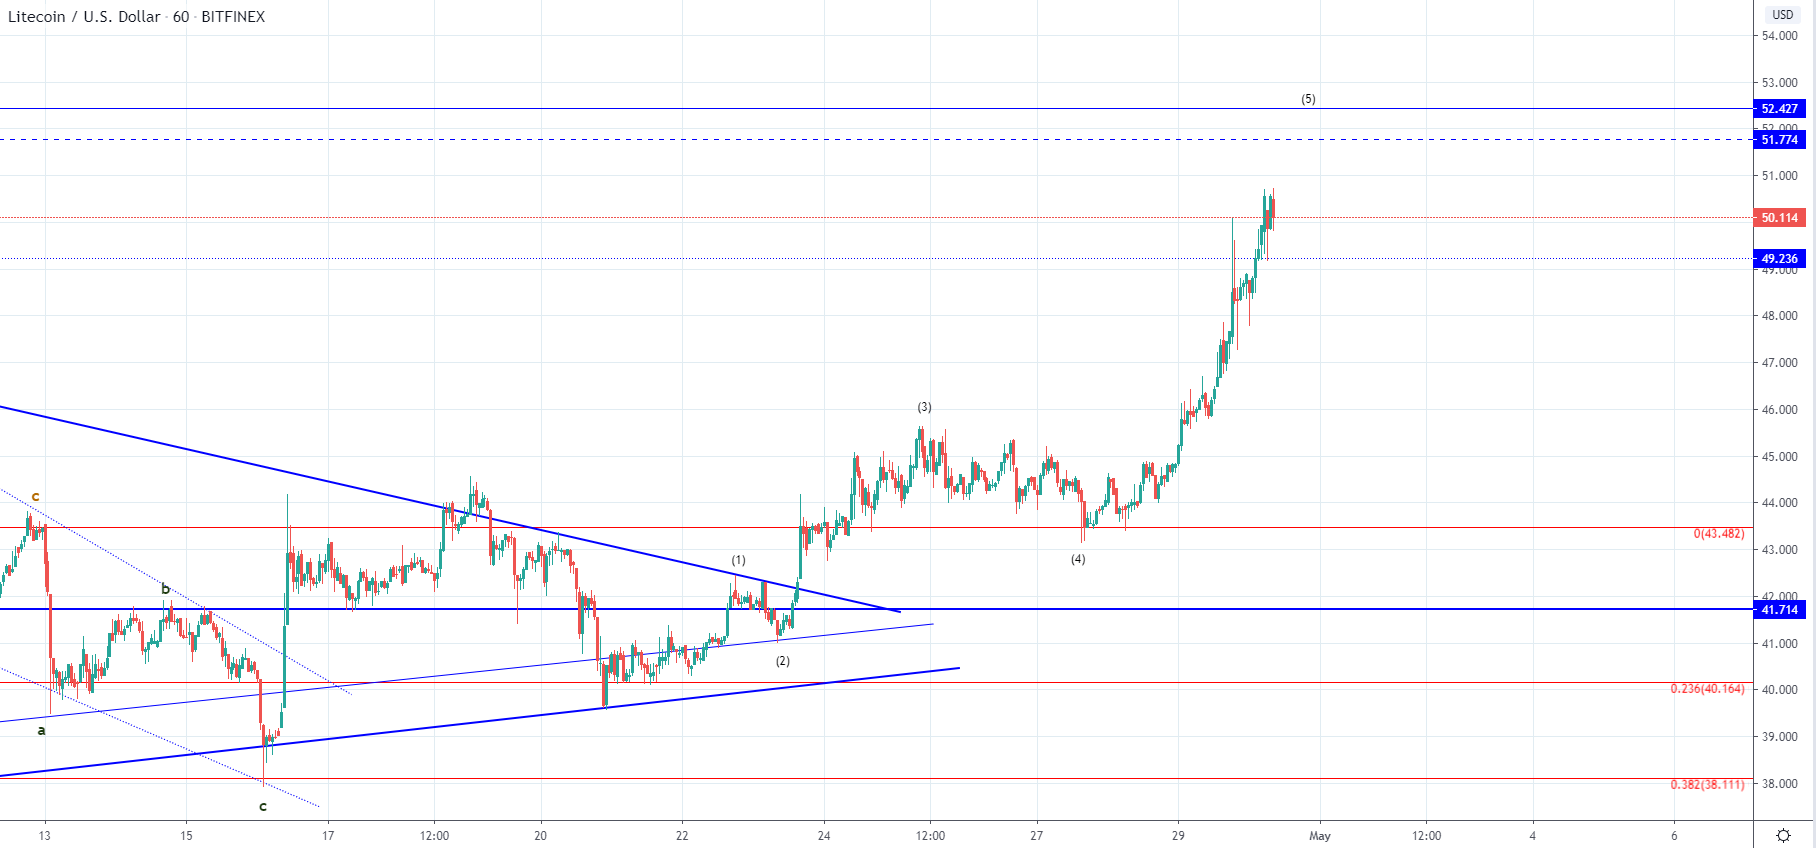 Looking at the hourly chart, we can see that the increase was made in a parabolic manner from Tuesday, breaking well above some key resistance point with strong bullish momentum. We have seen the formation of the five-wave structure from the 21st of April which is making this parabolic increase it’s ending wave. There is still more room to go but the price has come to the vicinity of the previous downside move cluster resistance is starting to encounter the next halt.
If this is the ending, 5th wave out of the impulse to the upside the price could continue increasing for a bit longer to the $52.4 horizontal level but shortly after a descending move should start. This descending move is likely to be an ABC Zigzag correction but it is still unclear whether or not it could be a sub-wave from the higher degree impulse out of which this one would be its 3rd wave. In either way considering the way price increased it’s unsustainability would prove it’s weakness on the way down which is why the start of the descending movement will be marked by a significant decline.
Most likely we are to see another increase as a spike to the upside with even stronger momentum but eventually, the equal amount of decrease as the price enters the seller’s territory and activates the seller’s pressure.
EOS/USD
The price of EOS has increased by 20.3% from last Thursday when it was sitting at $2.58 as it came up to $3.1 at it’s highest point today. Currently, it is being traded slightly lower but has maintained above the $3 mark.
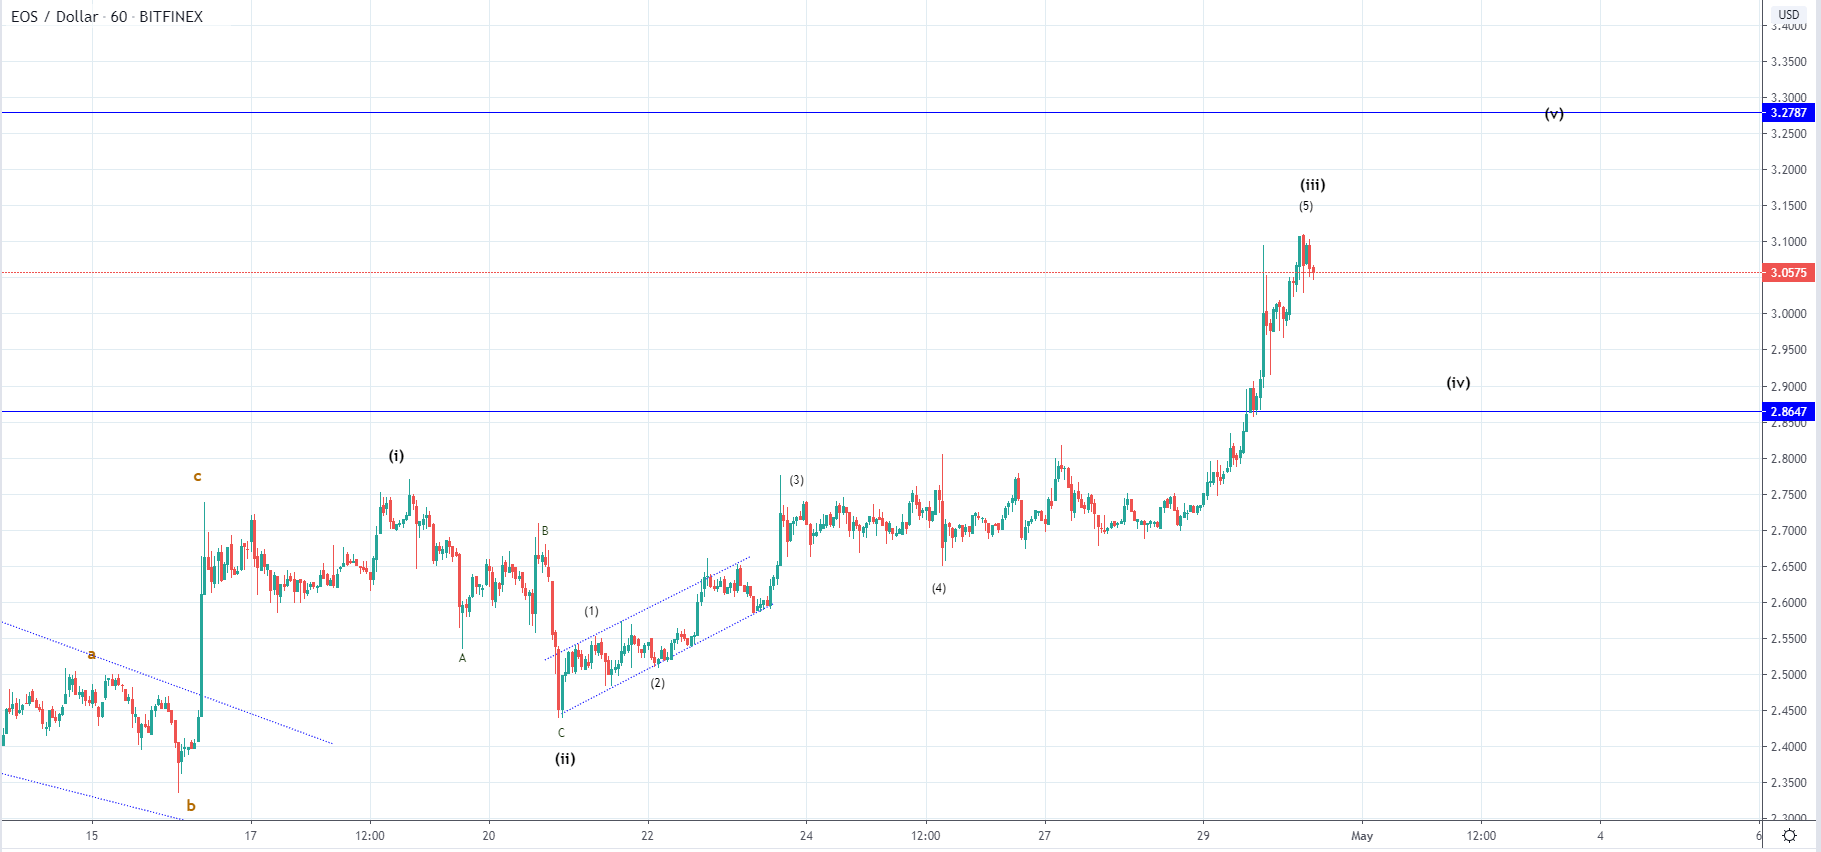 On the hourly chart, you can see a similar pattern to that of Litecoin with the price making a parabolic rise since the start of the week. Looking at the wave structure it appears that this could be the ending wave out of the five-wave impulse from the 21st but as in the case of Litecoin it could only be the 3rd from the higher degree one. The price is hovering around the half range between two significant horizontal levels so in the upcoming period we can see interaction with the upper one at $3.27, however, I don’t believe that the price is headed there in a straight line.
More likely we are to see a more significant pullback, potentially to around $2.9 area or even a retest of the broken resistance, before the uptrend continues.
FXOpen offers the world's most popular cryptocurrency CFDs*, including Bitcoin and Ethereum. Floating spreads, 1:2 leverage — at your service. Open your trading account now or learn more about crypto CFD trading with FXOpen.
*At FXOpen UK and FXOpen AU, Cryptocurrency CFDs are only available for trading by those clients categorised as Professional clients under FCA Rules and Professional clients under ASIC Rules respectively. They are not available for trading by Retail clients.
This article represents the opinion of the Companies operating under the FXOpen brand only. It is not to be construed as an offer, solicitation, or recommendation with respect to products and services provided by the Companies operating under the FXOpen brand, nor is it to be considered financial advice.
Latest from Cryptocurrencies
Latest articles

Since the Start of the Week, Brent Oil Price Has Dropped over 4%
At the beginning of the week, March 15, we wrote that the price of Brent oil could form a correction from the resistance level of USD 91 per barrel. Since then, the price has decreased by more than 4% due

Fair Value Gaps vs Liquidity Voids in Trading
Understanding fair value gaps and liquidity voids is essential for traders seeking to navigate the complexities of the financial markets. These concepts, deeply rooted in the Smart Money Concept (SMC), provide valuable insights into the dynamics of supply and demand,

UK100 Share Index Rises as UK Inflation Slows
Yesterday, the UK Office for National Statistics (ONS) reported that the CPI stood at 3.2% in March. According to ForexFactory, analysts expected 3.1%, and a month ago the index was 3.4%.
Grant Fitzner, chief economist at the