


FXOpen

LTC/USD
From Mondays low at $42.76 the price of Litecoin has increased by 13.61% measured to its highest point at $48.58 made yesterday. The price is currently being traded at $47.451 as a minor retracement has occurred of around 2.16%.
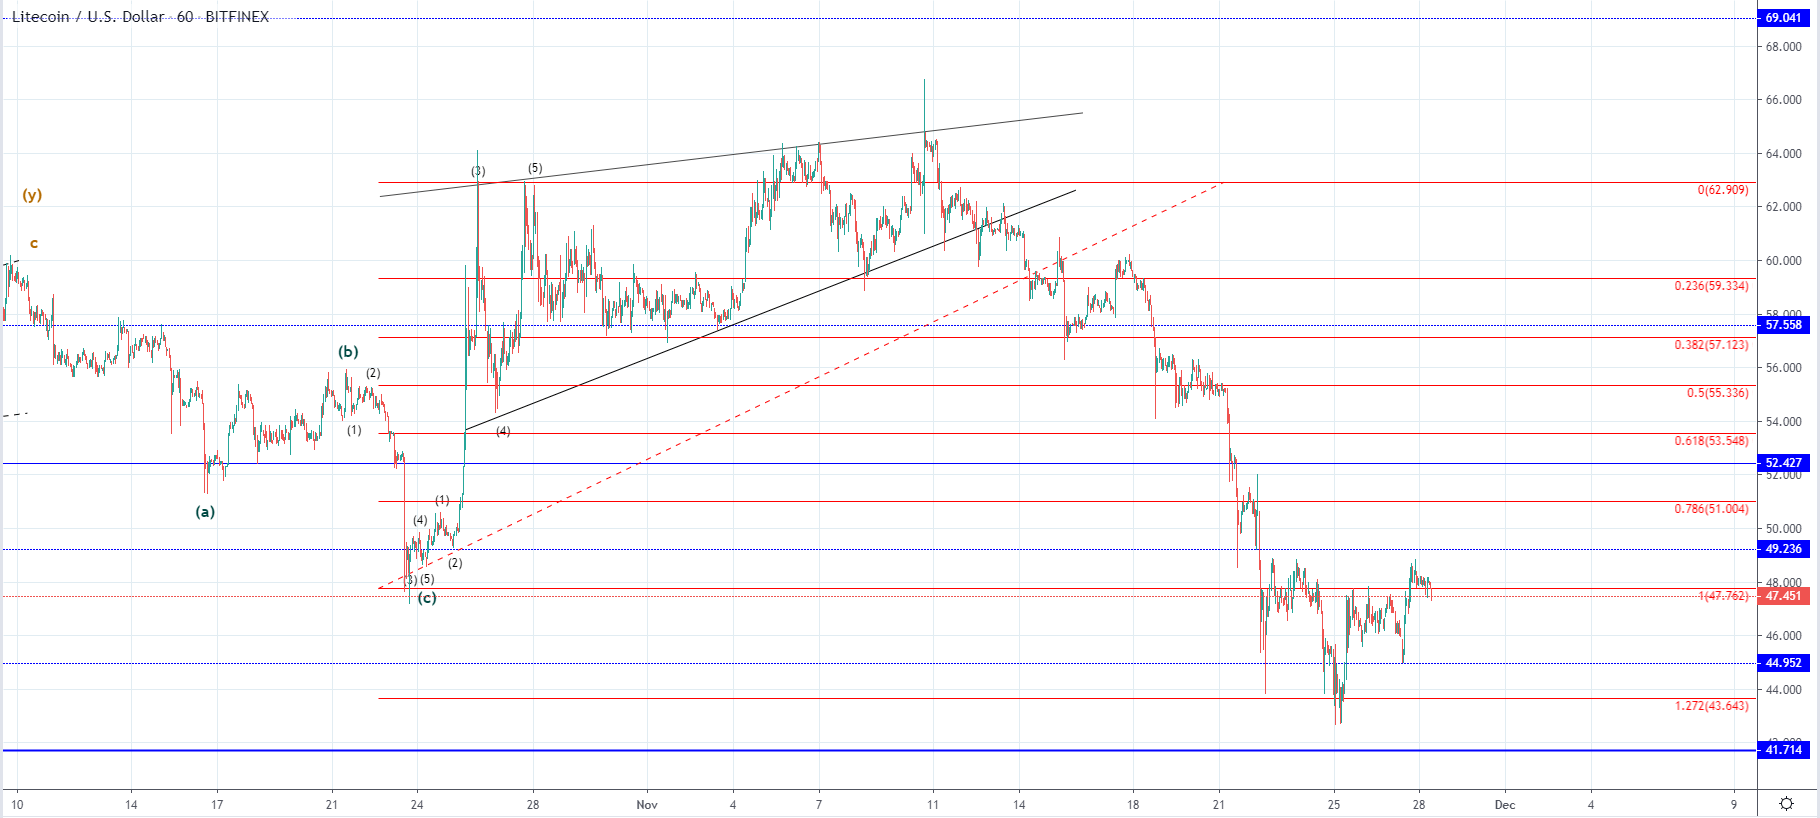
Looking at the hourly chart, we can see that the price of Litecoin found support on the 1.272 Fib level on Monday’s low after a decrease of 33.88% measured from its highest point on the 10. November at $64.66. This has most likely been the end of the decrease after a breakout from the ascending triangle with the price making a lower low.
As a lower low was made compared to the one at $47.8 on the 23rd of October the count in which we have seen the starting impulse wave to the upside was invalidated. This means that the price of Litecoin is undergoing another corrective move which is a three-wave one to the upside. In that case, the new seen increase is its developing 3rd wave after which the price will continue moving to the downside establishing further lows.
This will be evaluated from the expected increase which is to develop in a five-wave manner and likely below the previous high somewhere around the 0.382 Fibonacci level where the significant horizontal support also was.
EOS/USD
The price of EOS was sitting at $2.357 at its lowest point on Monday from where we have seen an increase of 15.76% measured to its highest point yesterday at $2.7288. A minor retracement has occurred with the price currently sitting slightly lower than yesterday but is above the previous minor high retesting its resistance for support.
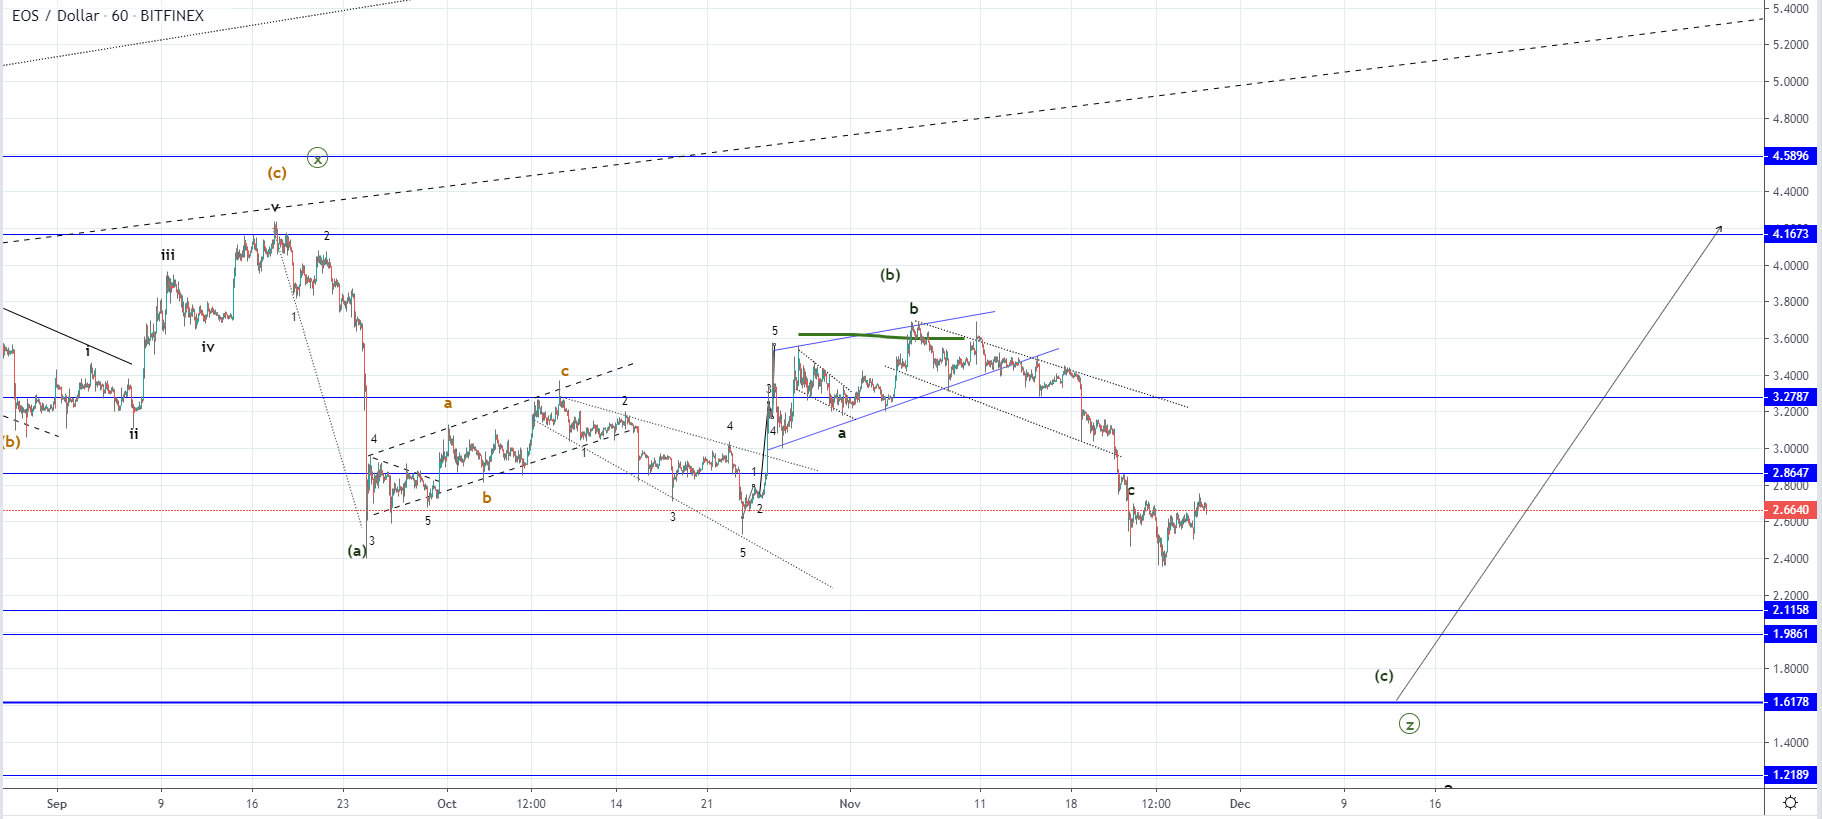
On the hourly chart, we can see that like in the case of Litecoin the price made a lower low compared to the one at $2.66 which is actually currently being tested for resistance. This means that the corrective stage still hasn’t ended and that further lows could be expected before its completion.
The decrease seen after a breakout from the ascending triangle is considered the third wave out of the ABC correction to the downside which is the Z wave of a higher degree. If this is true, then the C wave should develop in a five-wave manner which I don’t believe that it has which is why I would be expecting an interaction with some of the horizontal support levels below. The most significant horizontal level is at $1.617 at it’s December 2018 low but I don’t believe that the price could go there in a straight line.
More likely the decrease would end somewhere in the $2 area as if we project the length of the A wave on to the B wave’s ending point, the target for the C wave ends in that zone.
FXOpen offers the world's most popular cryptocurrency CFDs*, including Bitcoin and Ethereum. Floating spreads, 1:2 leverage — at your service. Open your trading account now or learn more about crypto CFD trading with FXOpen.
*At FXOpen UK and FXOpen AU, Cryptocurrency CFDs are only available for trading by those clients categorised as Professional clients under FCA Rules and Professional clients under ASIC Rules respectively. They are not available for trading by Retail clients.
This article represents the opinion of the Companies operating under the FXOpen brand only. It is not to be construed as an offer, solicitation, or recommendation with respect to products and services provided by the Companies operating under the FXOpen brand, nor is it to be considered financial advice.
Latest from Cryptocurrencies
Latest articles

Weekly Market Wrap With Gary Thomson: UK100, USD, GOLD, OIL
Get the latest scoop on the week's hottest headlines, all in one convenient video. Join Gary Thomson, the COO of FXOpen UK, as he breaks down the most significant news reports and shares his expert insights.
- UK100 Share Index Rises

What Is a Darvas Box Theory and How Does It Work in Trading?
The Darvas Box Theory, pioneered by Nicolas Darvas in the 1950s, has transcended its stock market origins to become a valuable tool for forex traders. This method leverages specific price movements and patterns, known as the Darvas Box, to track

NFLX Stock Price Falls Despite Subscriber Growth
Yesterday, after the close of the main trading session on the stock market, Netflix reported to investors for the 1st quarter of 2024.
The report turned out better than expected:
→ earnings per share: actual = USD 5.28, forecast = USD 4.