


FXOpen

LTC/USD
From last week when the price of Litecoin was sitting at $46.3 level at its lowest, we have seen an increase of 21.64% as the price came up to $56.32 at its highest point today. Now it is being slightly lower but we have seen strong bullish momentum behind the price action and is still in an upward trajectory.
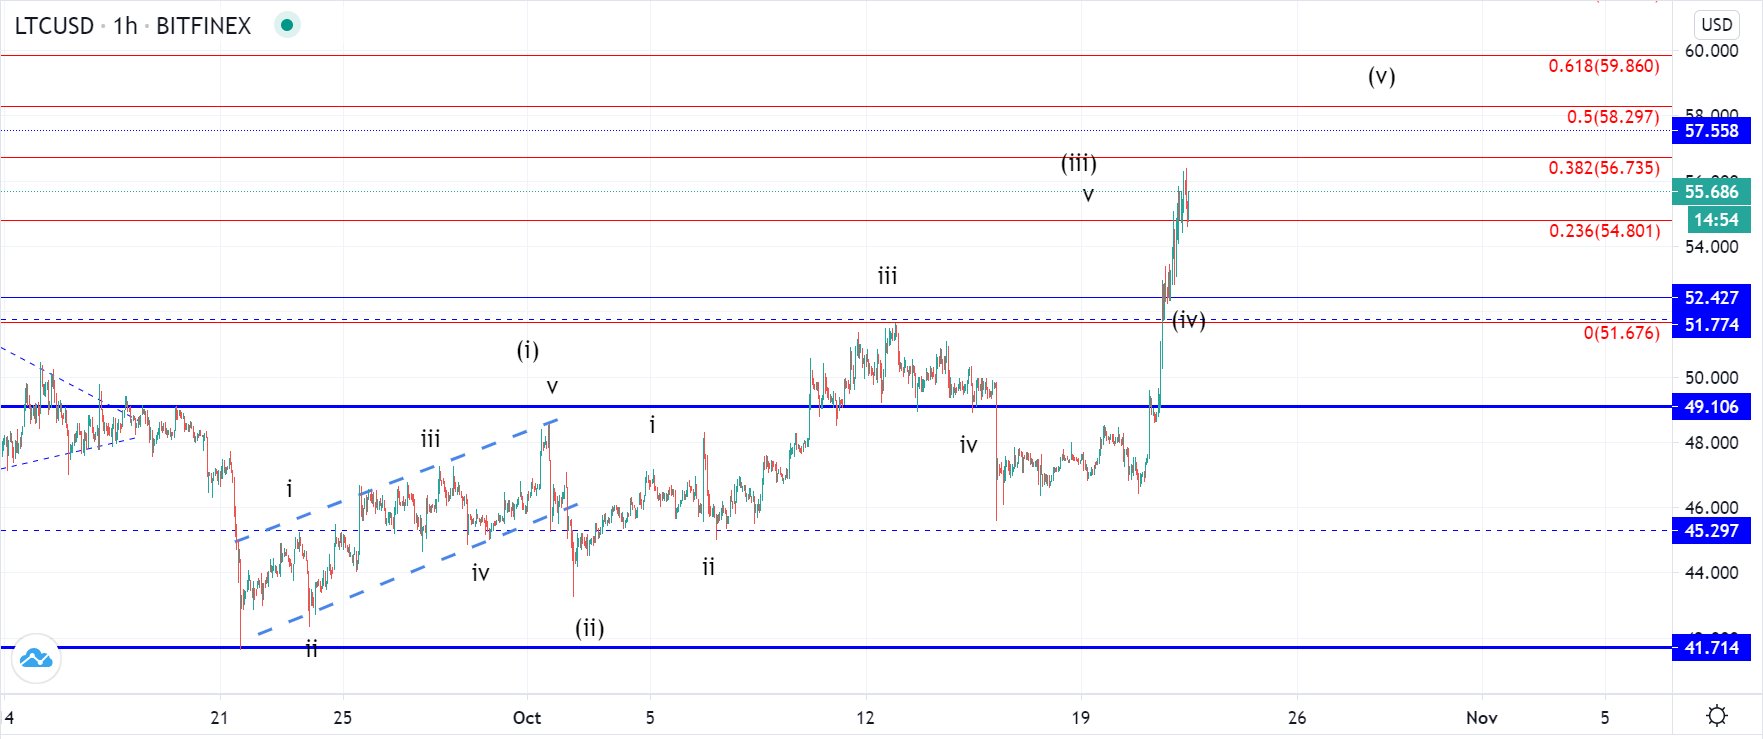
On the hourly chart, you can see that a breakout was made into the range above the 0.236 Fibonacci level. This was expected as the 3rd wave of the higher degree count and the price came up to those levels but there weren’t been any signs yet of the momentum slowing down. A pullback would be the 4th wave which means that another increase would be expected next to the vicinity of the 0.5 Fib level at around $58.3 zone.
As the price continues increasing and has been showing bullish momentum a pullback of the same degree would be expected to develop shortly but considering the power behind the move, it might not be so deep as expected. We could see some kind of an ascending range in the form of the triangle or a channel for the completion of the 5th wave.
EOS/USD
The price of EOS has experienced an increase of 7.6% coming from the $2.5 level on Tuesday to $2.7 at its highest point today. The amount of increase isn’t as significant but a breakout that was made on Monday was validated by the interaction with the descending trendline where it found support.
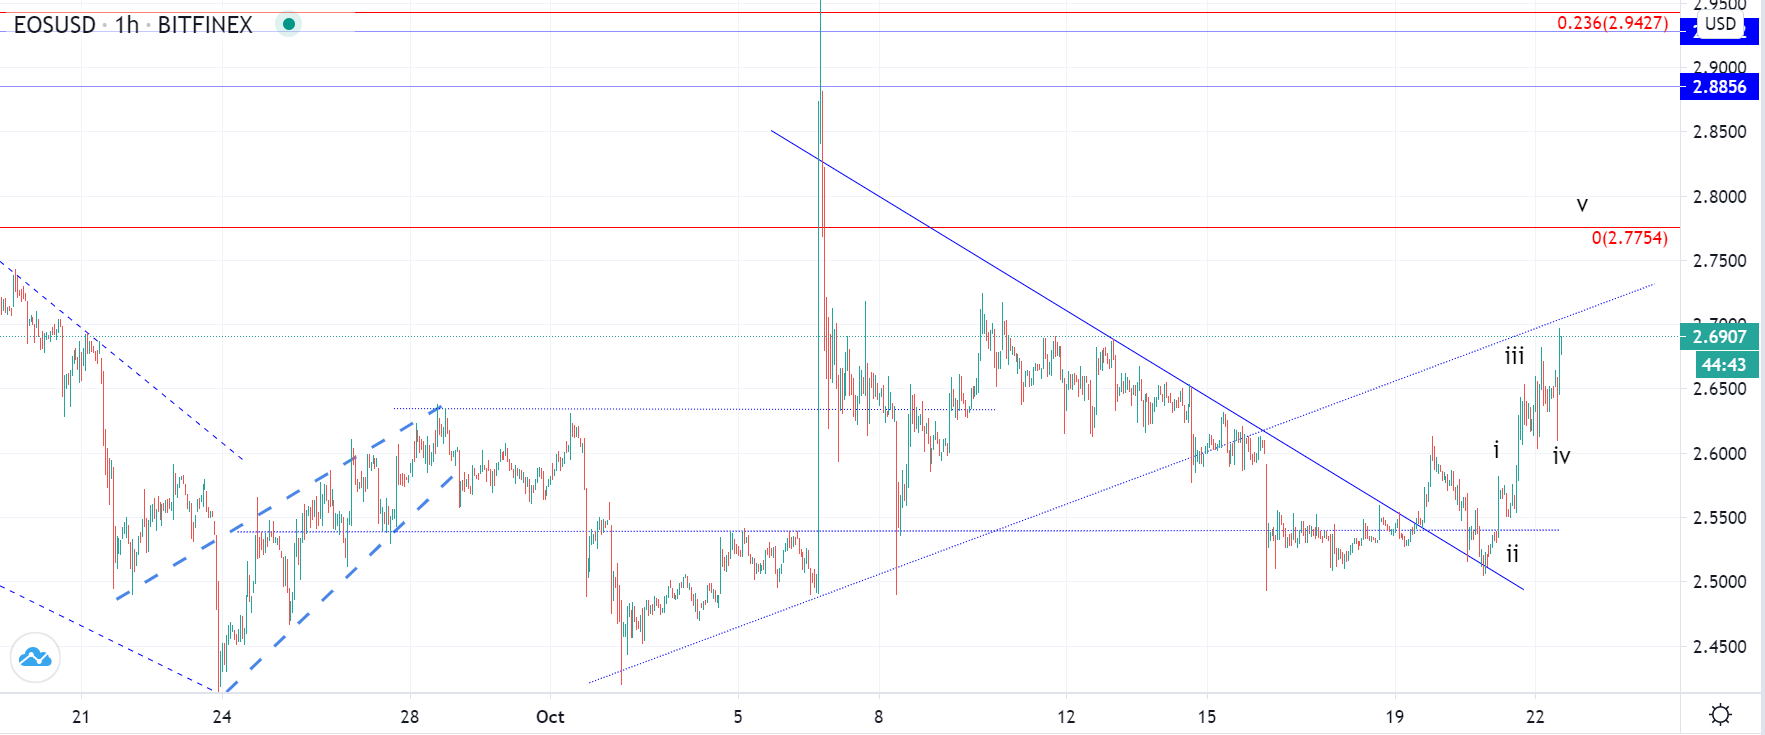
Now the price is coming to test the ascending level from the beginning of October and is likely to finds resistance there as the level has been highly significant. The wave structure has been showing the completion of the five-wave move so the breakout momentum looks like it coming to an end, and considering the significance behind the ascending trendline, it could be very soon.
Another possibility could be that the price would spike further to the upside to around the $2.7754 level where the 0 Fibonacci level and then falls down back to test the ascending level from the upper side for support. After another minor pullback, the uptrend would be expected to continue as the price has been showing strong bullish signs with a breakout being validated from the descending resistance level.
If the price continues increasing beyond the 0 Fibonacci level a spike to the 0.236 Fib level would look likely as another spike like the one made on the 6th of October could occur.
FXOpen offers the world's most popular cryptocurrency CFDs*, including Bitcoin and Ethereum. Floating spreads, 1:2 leverage — at your service. Open your trading account now or learn more about crypto CFD trading with FXOpen.
*At FXOpen UK and FXOpen AU, Cryptocurrency CFDs are only available for trading by those clients categorised as Professional clients under FCA Rules and Professional clients under ASIC Rules respectively. They are not available for trading by Retail clients.
This article represents the opinion of the Companies operating under the FXOpen brand only. It is not to be construed as an offer, solicitation, or recommendation with respect to products and services provided by the Companies operating under the FXOpen brand, nor is it to be considered financial advice.
Latest articles

Weekly Market Wrap With Gary Thomson: UK100, Hang Seng Index, AUD/JPY, GBP/USD, USD/CAD
Get the latest scoop on the week's hottest headlines, all in one convenient video. Join Gary Thomson, the COO of FXOpen UK, as he breaks down the most significant news reports and shares his expert insights.
- UK100 Analysis: Stock Market

What Is the ICT Silver Bullet Strategy, and How Does It Work?
The ICT Silver Bullet strategy offers traders a unique approach to capitalising on market opportunities during specific trading hours. This article explored this advanced strategy, explaining the role of fair value gaps, liquidity, and timeframes and how to implement it.

Analytical Euro to Dollar Predictions for 2024-2025
The EUR/USD currency pair stands as a critical barometer of economic interactions and the relative strength between the Eurozone and the United States. This article delves into the recent history, economic outlooks, and analytical euro-to-dollar forecasts for this major