


FXOpen
LTC/USD
From last week’s Thursday when the price of Litecoin was sitting at $45.58 at its lowest points, we have seen an increase of 13.38% measured to the highest point the price has been this week at $51.68. Since Monday’s high a pullback developed to the significant horizontal resistance level at $49.106 which was broken on the way up and the price is currently testing it for support.
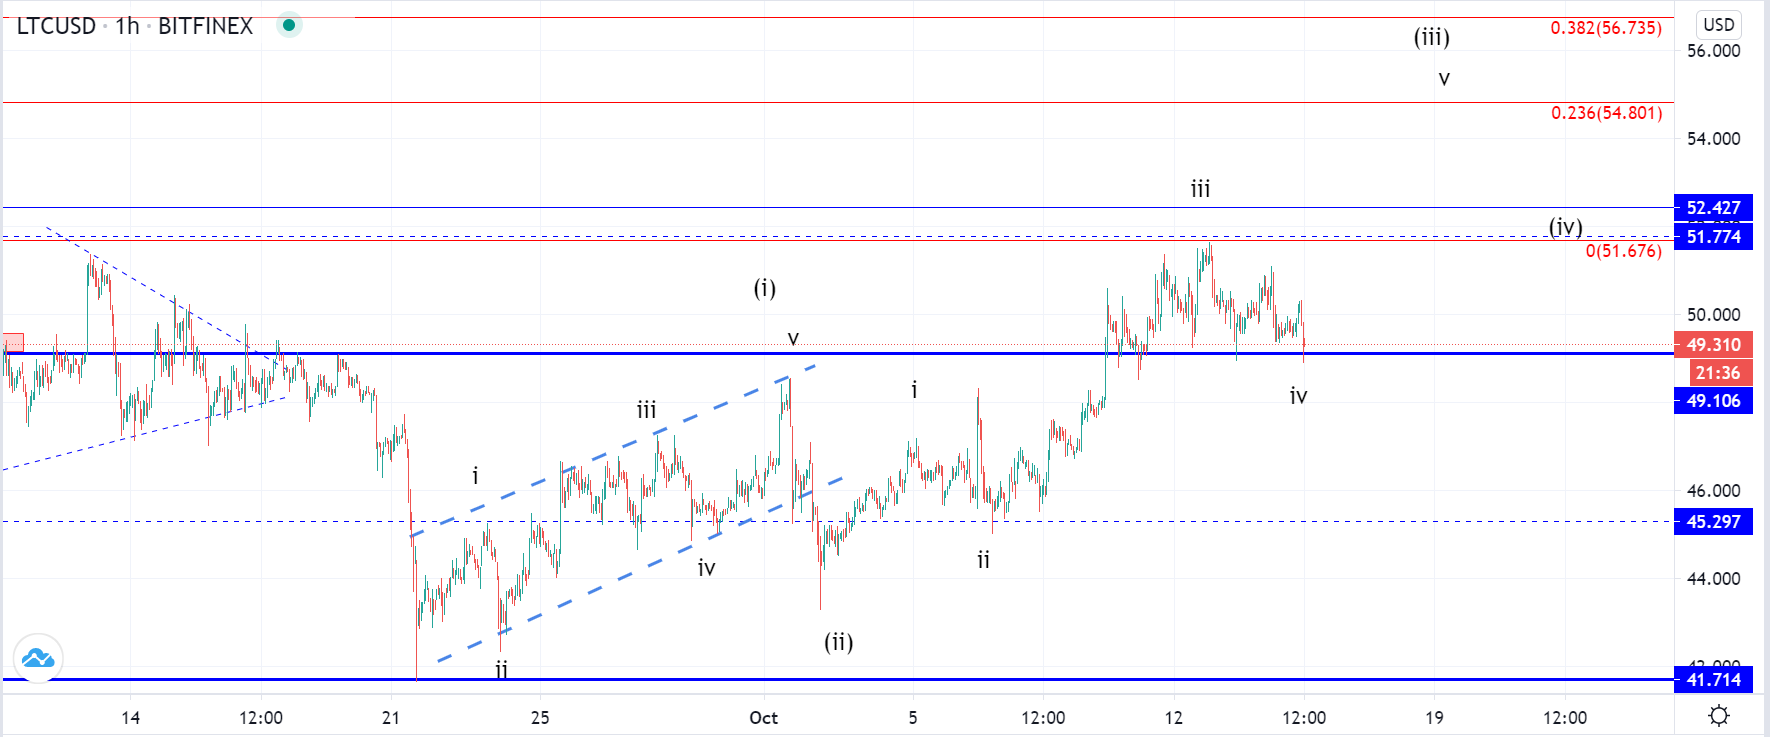
On the hourly chart, you can see that the price made an interaction today with the mentioned significant horizontal support and from the current candle it appears that the support is going to be present at those levels. More so this pullback should be a corrective one as the 4th wave out of the five-wave impulse to the upside would develop fully, further higher highs would be expected.
From the 21st of September, we have seen the formation of an ascending channel which was most likely the 1st wave out of the starting impulse and was a leading diagonal formation. If this is true, then the move to the downside that occurred in the first days of October was the 2nd wave which means that now we are seeing the development of the 3rd higher degree impulse.
As it hasn’t developed fully another higher high would be expected before its completion but that wouldn’t be the end of the expected increase as the price would manage to exceed the 0.5 Fib level and would have two more waves to develop.
EOS/USD
The price of EOS has been showing choppy price action since last week when it spiked to almost $3 on the 6th of October but fell back to the starting point of the increase at around $2.5 on the 8th. Since then another increase was seen to the $2.7 zone but from there a downtrend to $2.59 at its lowest yesterday.
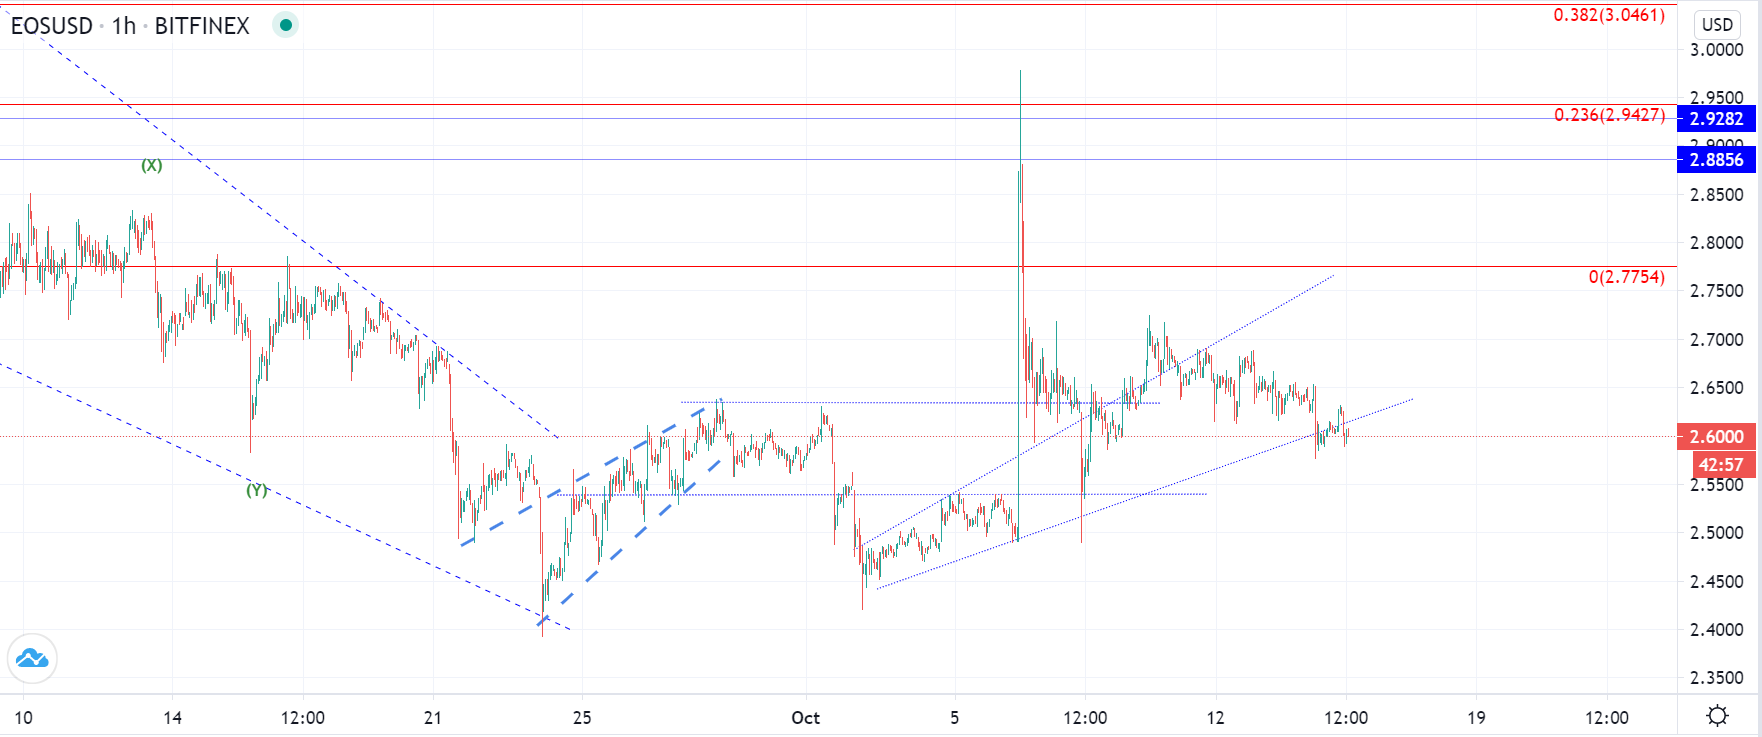
Currently, the price is being traded around those levels and has started to show early signs for bullishness as a minor high low was made today compared to yesterday’s one. Even though the price came below the horizontal level of the prior high, it found support on a slightly lower one which was the support zones’ lower level.
As the support looks present, further uptrend continuation would be expected, especially considering the market correlation and what’s been said about the price of Litecoin. We could be seeing a corrective increase but even so another higher high would be expected for its completion which in the case of EOS would likely be at around $3 where the price spiked on the 6th.
FXOpen offers the world's most popular cryptocurrency CFDs*, including Bitcoin and Ethereum. Floating spreads, 1:2 leverage — at your service. Open your trading account now or learn more about crypto CFD trading with FXOpen.
*At FXOpen UK and FXOpen AU, Cryptocurrency CFDs are only available for trading by those clients categorised as Professional clients under FCA Rules and Professional clients under ASIC Rules respectively. They are not available for trading by Retail clients.
This article represents the opinion of the Companies operating under the FXOpen brand only. It is not to be construed as an offer, solicitation, or recommendation with respect to products and services provided by the Companies operating under the FXOpen brand, nor is it to be considered financial advice.
Latest articles

USD to CAD Analytical Predictions in 2024, 2025 and Beyond
This comprehensive article delves into the intricacies of the USD to CAD exchange rate, exploring the factors that may influence its trajectory in 2024, 2025, and beyond. From economic outlooks to key market drivers, this article provides valuable insights for

France Joins European Stock Boom as CAC 40 Index Heads for Highs
This decade has been full of market-disrupting surprises, placing it as completely different to any other decade experienced by residents of Western Europe and North America since the end of the Second World War.
The only constant dynamic since the

Gold Price (XAU/USD) Is Testing an Important Resistance Zone
On April 16, we wrote why the $2,380 zone is an important resistance area.

The XAU/USD chart shows that:
1) After fading fluctuations (they formed a narrowing consolidation triangle - shown in green), the price of gold dropped