


FXOpen

LTC/USD
From last week’s high made on Monday when the price of Litecoin was sitting at $45.88, we have seen a decrease to the significant horizontal support level at $41.71 where it found support and consequently made a bounce from it and came to the $44.6. Since then we have seen another two retests of the mentioned horizontal level finding support there both times and is now again in the upward trajectory but still lower then on the first bounce.
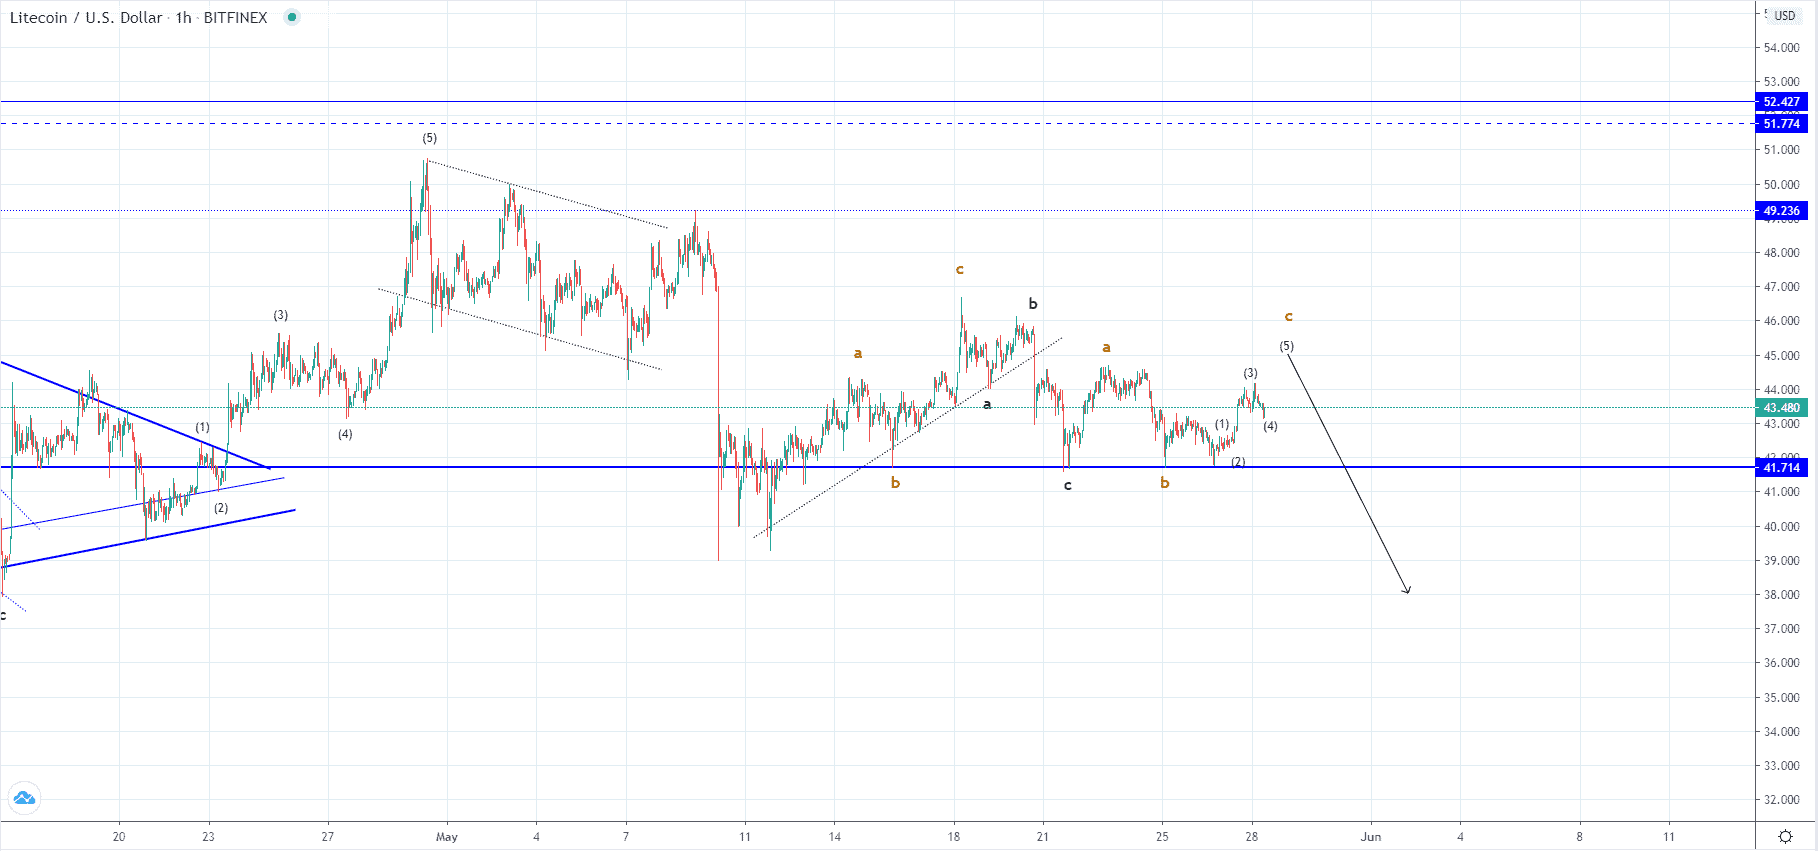
As you can see by looking at the hourly chart the price is close to the vicinity of the prior high and is expected to continue moving exactly to it as a retest of those levels. The first bounce after a test of the horizontal support is considered to be the A wave from the upward ABC correction that started developing as the 2nd wave of the lower degree from the descending higher degree one.
This is why after the completion of the current upward movement which is considered to be the C wave I would be expecting a breakout to the downside below the significant horizontal level. It is still unclear where the price could end it decreases as there are multiple support points, but if we take a clue from the spiky impulse that was made on the 1oth of May whose continuation this expected movement would be we are to see a significant decrease of around 15% which would bring the price of Litecoin to around the $38 area.
EOS/USD
The price of EOS has been following the same price pattern as in the case of LTC as we have seen a decrease of around $11.8% from last Monday’s high after which an increase was made and a couple of retests around the same vicinity before the start of the current upward movement.
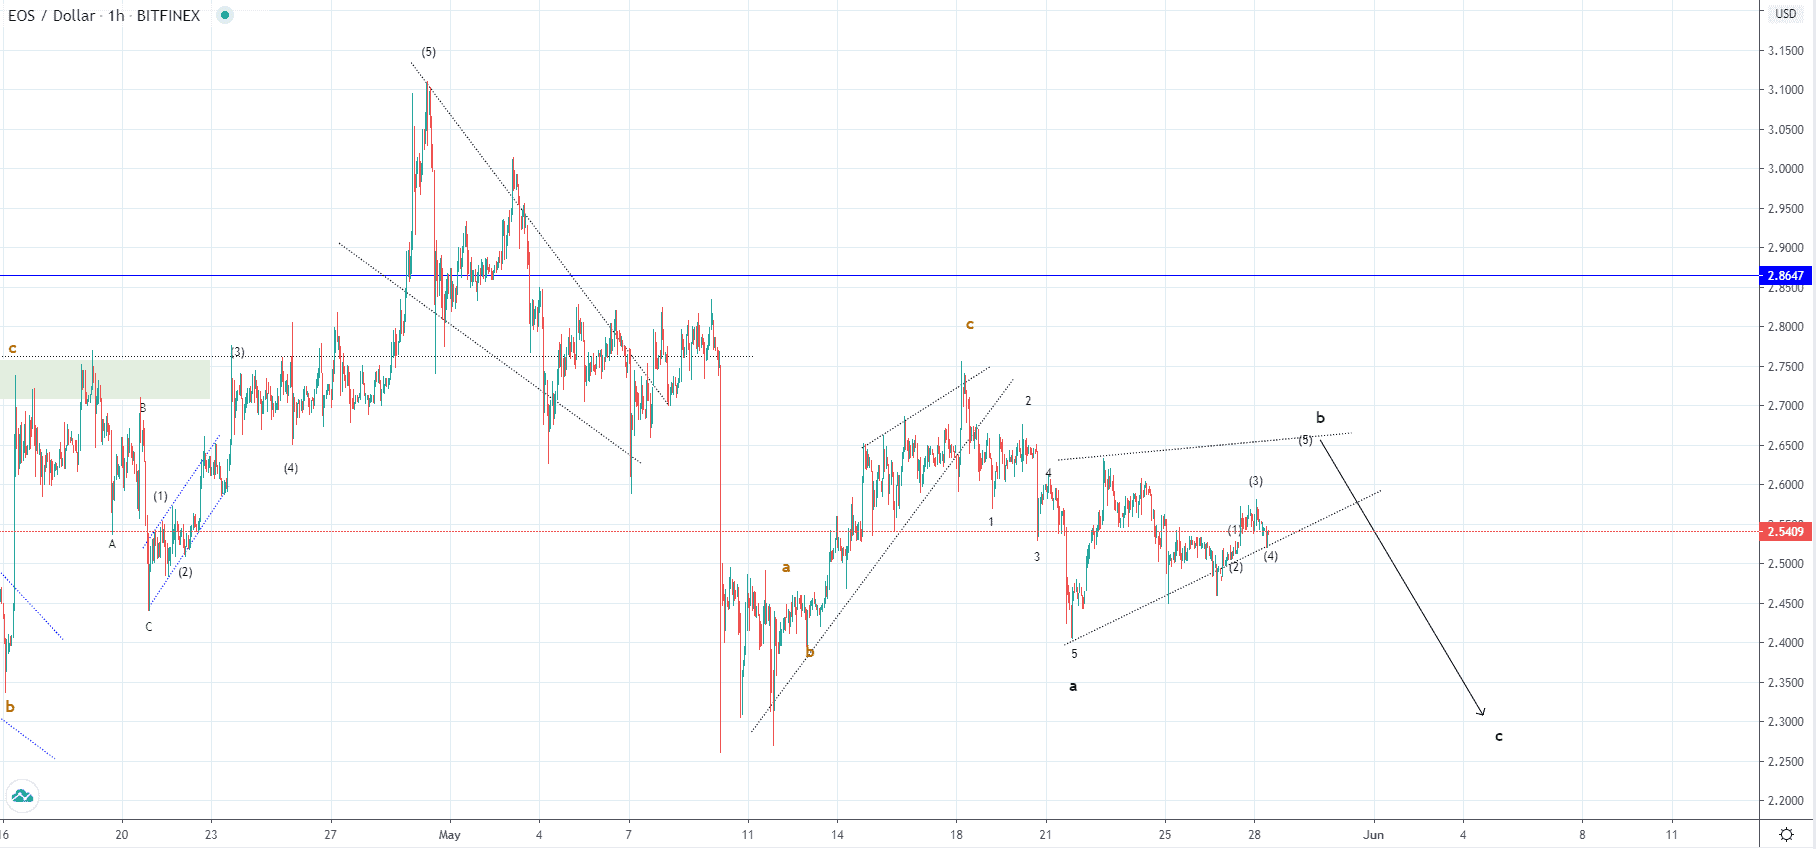
On the hourly chart, you can see that last Monday’s decline was made in a five-wave manner which appears to be the starting wave of the next descending wave after it corrected to the upside in a three-wave manner. From the current price point, an increase would be expected to $2.65 at the furthest as we have most likely already seen the development of three waves from the five-wave move that is the C wave. At the most optimal we are going to see a retest of the prior high which would around $2.63.
But after this increase end a breakout would be expected to the downside below the low made on the 1oth of May, or around its vicinity which is at $2.3.
FXOpen offers the world's most popular cryptocurrency CFDs*, including Bitcoin and Ethereum. Floating spreads, 1:2 leverage — at your service. Open your trading account now or learn more about crypto CFD trading with FXOpen.
*At FXOpen UK and FXOpen AU, Cryptocurrency CFDs are only available for trading by those clients categorised as Professional clients under FCA Rules and Professional clients under ASIC Rules respectively. They are not available for trading by Retail clients.
This article represents the opinion of the Companies operating under the FXOpen brand only. It is not to be construed as an offer, solicitation, or recommendation with respect to products and services provided by the Companies operating under the FXOpen brand, nor is it to be considered financial advice.
Latest from Cryptocurrencies
Latest articles

Weekly Market Wrap With Gary Thomson: UK100, USD, GOLD, OIL
Get the latest scoop on the week's hottest headlines, all in one convenient video. Join Gary Thomson, the COO of FXOpen UK, as he breaks down the most significant news reports and shares his expert insights.
- UK100 Share Index Rises

What Is a Darvas Box Theory and How Does It Work in Trading?
The Darvas Box Theory, pioneered by Nicolas Darvas in the 1950s, has transcended its stock market origins to become a valuable tool for forex traders. This method leverages specific price movements and patterns, known as the Darvas Box, to track

NFLX Stock Price Falls Despite Subscriber Growth
Yesterday, after the close of the main trading session on the stock market, Netflix reported to investors for the 1st quarter of 2024.
The report turned out better than expected:
→ earnings per share: actual = USD 5.28, forecast = USD 4.