


FXOpen

LTC/USD
From last Wednesday when the price of Litecoin fell to $36.79 at its lowest point, measured to Monday’s high at $42.56 we have seen an increase of 15.68%. Since Monday’s high the price has been in a downward trajectory and is currently being traded around its lowest of the week which is at around $40.
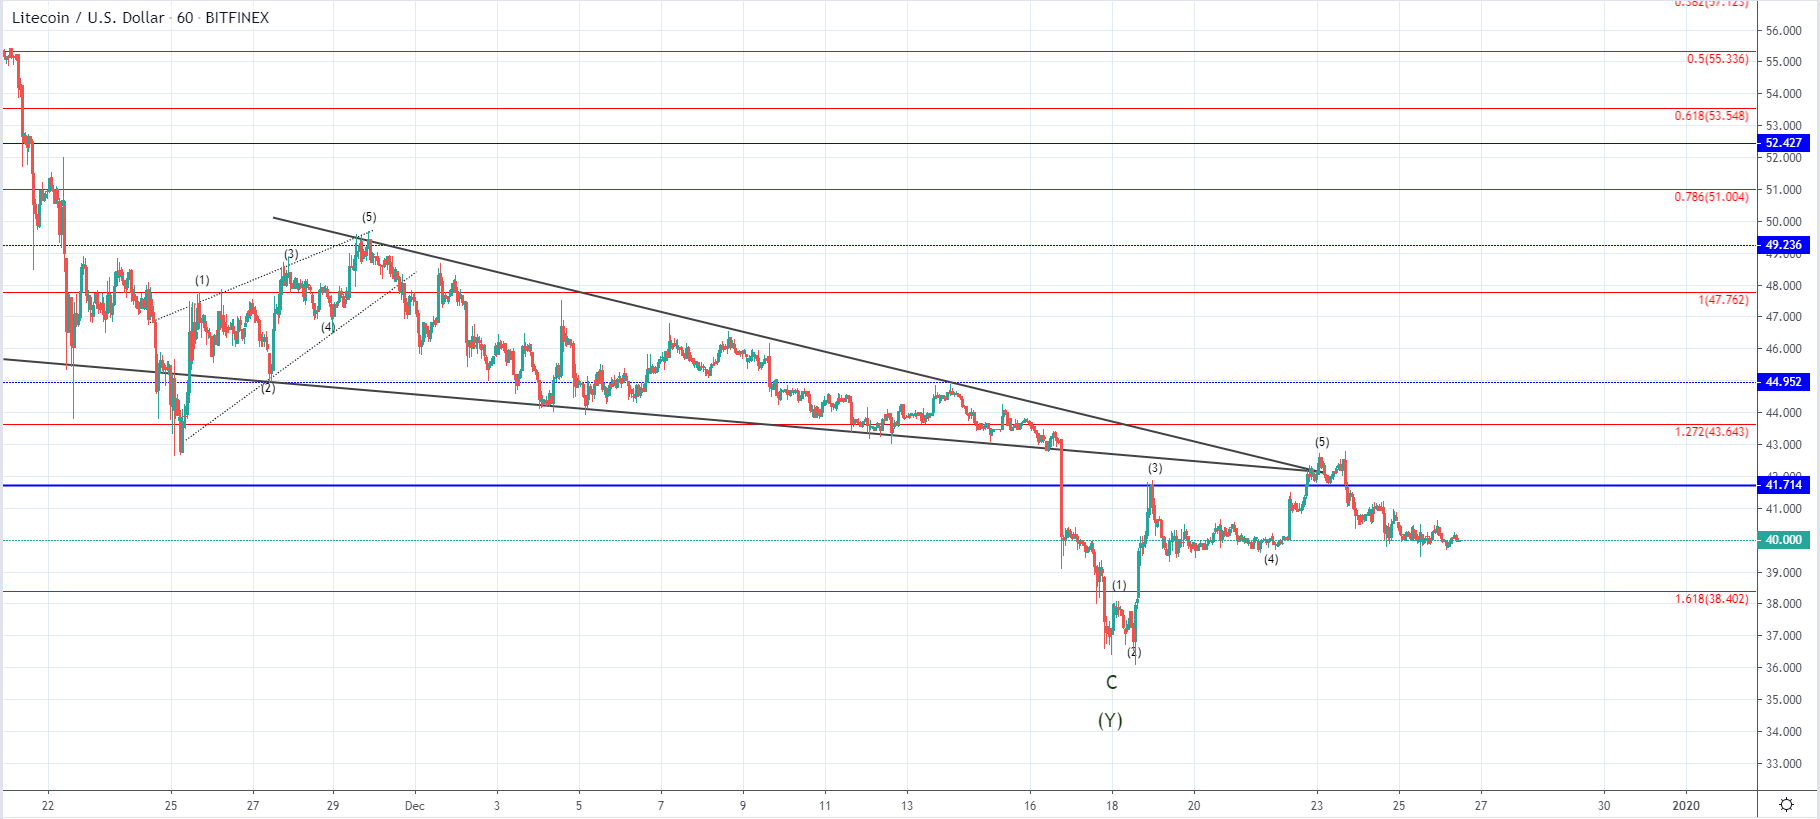 Looking at the hourly chart, you can see that the price broke down from the descending triangle last week with strong bearish momentum indicating impulsiveness. The price fell below 1.618 Fibonacci level but as it entered the buyer’s territory, buying was activated and we have seen a recovery close to the vicinity of the resistance level from the descending triangle. This could be interpreted as a retest of its support for resistance especially considering that the price came only for a short while above $41.7 horizontal level. Resistance was found as seen on the chart, which is why another downside move has been seen.
This could be a minor retracement before the next wave to the upside starts, considering that we have seen a five-wave increase. But considering that the price broke out from the descending triangle and formed another five-wave move to the upside we could have seen the C wave out of the ABC to the upside with the prior ascending triangle being its A wave.
From the depth of the current retracement and the momentum of the next move to the upside, we are going to evaluate these possibilities.
EOS/USD
Like in the case of Litecoin, the price of EOS has recovered significantly from last Wednesday when it was sitting at $2.19 at its lowest point, coming to $2.6 at its highest on Monday this week which was an increase of 18.6%. Currently, the price is being traded at around $2.49 as it was in a downward trajectory since the start of the week.
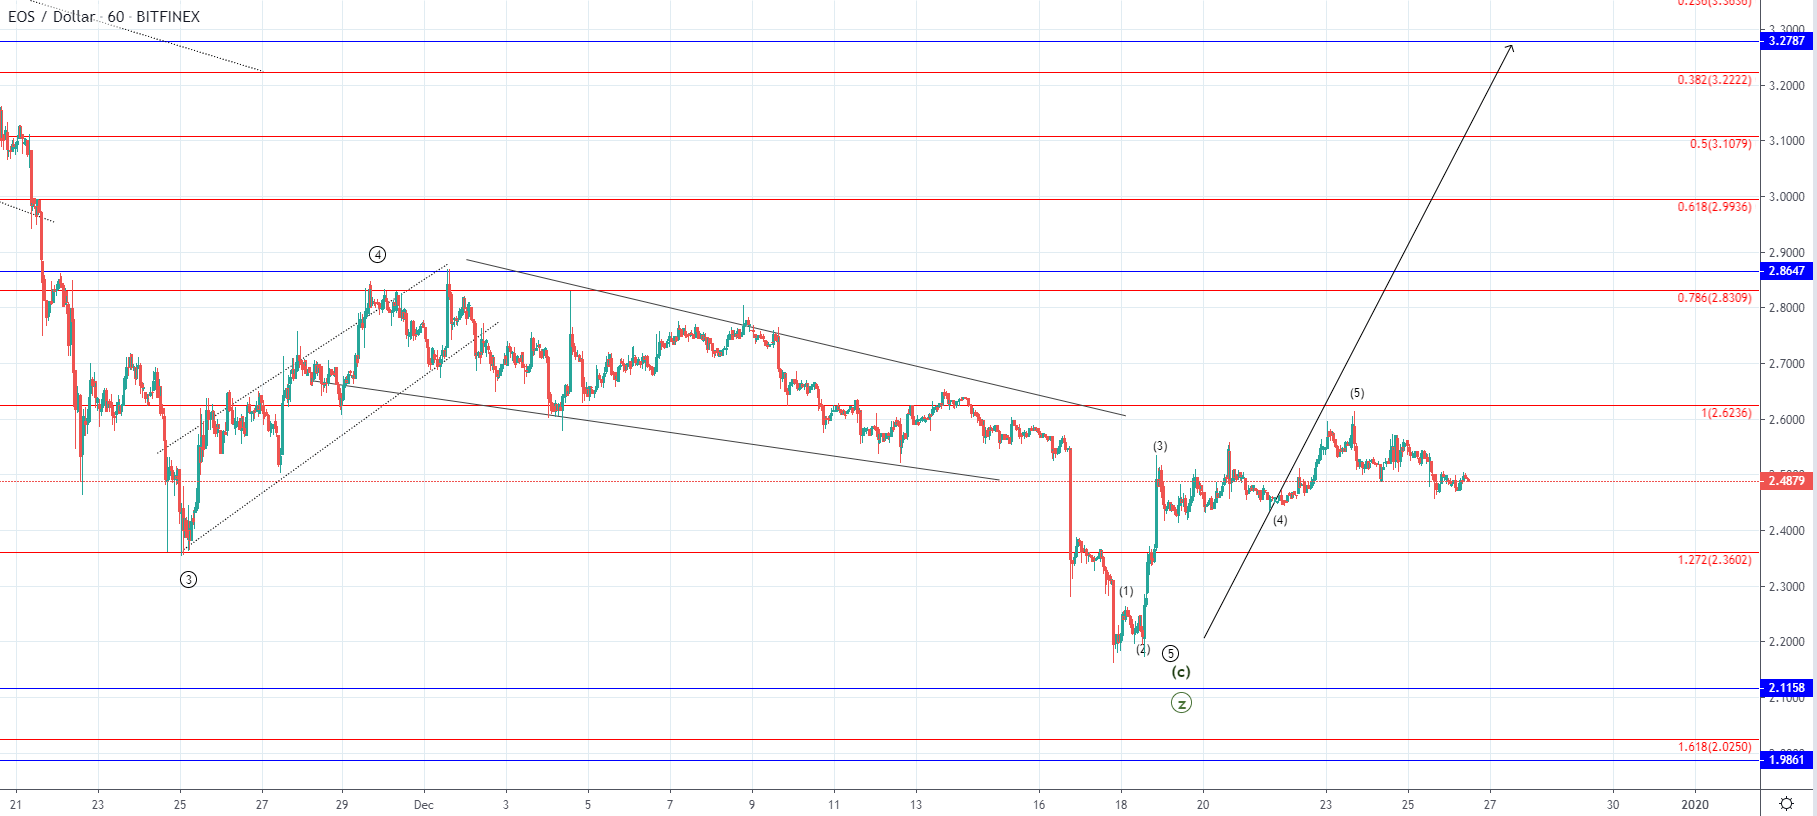
As you can see by looking at the hourly chart, I was expecting this spike to the upside but as the beginning of the larger recovery. A five-wave move to the upside developed which could be the 1st sub-wave of the higher degree impulse wave. If this is true then the decline seen from Monday is its 2nd wave developing which can push the price all the way back to the prior low although unlikely.
More likely we are to see a retest of the prior higher low at 1.272 Fib level before further uptrend continuation if this is a starting impulse. If the price, however, goes below the 1.272 Fibonacci level it will indicate that the spike seen from last Wednesday till Monday this week could have been the C wave out of the ABC to the upside with further lows ahead.
FXOpen offers the world's most popular cryptocurrency CFDs*, including Bitcoin and Ethereum. Floating spreads, 1:2 leverage — at your service. Open your trading account now or learn more about crypto CFD trading with FXOpen.
*At FXOpen UK and FXOpen AU, Cryptocurrency CFDs are only available for trading by those clients categorised as Professional clients under FCA Rules and Professional clients under ASIC Rules respectively. They are not available for trading by Retail clients.
This article represents the opinion of the Companies operating under the FXOpen brand only. It is not to be construed as an offer, solicitation, or recommendation with respect to products and services provided by the Companies operating under the FXOpen brand, nor is it to be considered financial advice.
Latest articles

Google Share Price Rose Post-market to a New All-time Record
Yesterday, after the close of the main trading session, a report on activities for the 1st quarter of Alphabet Inc. (Google's parent company) was published. The report was strong, exceeding investors' expectations.
→ Quarterly EPS = USD 1.89 (expected = USD 1.

S&P 500 Rebounds after Negative GDP News
Data released yesterday showed US GDP growth slowed to 1.6% in the first quarter of the year. According to ForexFactory: forecast = 2.2%, past value = 2.4%.
Reaction to the news sent the S&P 500 mini stock

GBP/USD And USD/CAD Daily Chart Outlook
GBP/USD is attempting a recovery wave from 1.2300. USD/CAD is consolidating and might aim for a move above the 1.3760 resistance zone.
Important Takeaways for GBP/USD and USD/CAD Analysis Today
· The British Pound started