


FXOpen
LTC/USD
The price of Litecoin has been decreasing from Tuesday when it reached the $93.9 level and made a decline of 24.3% measured to its lowest point today $70.6. Currently, the price is being traded slightly higher but is still in a steep downward trajectory.
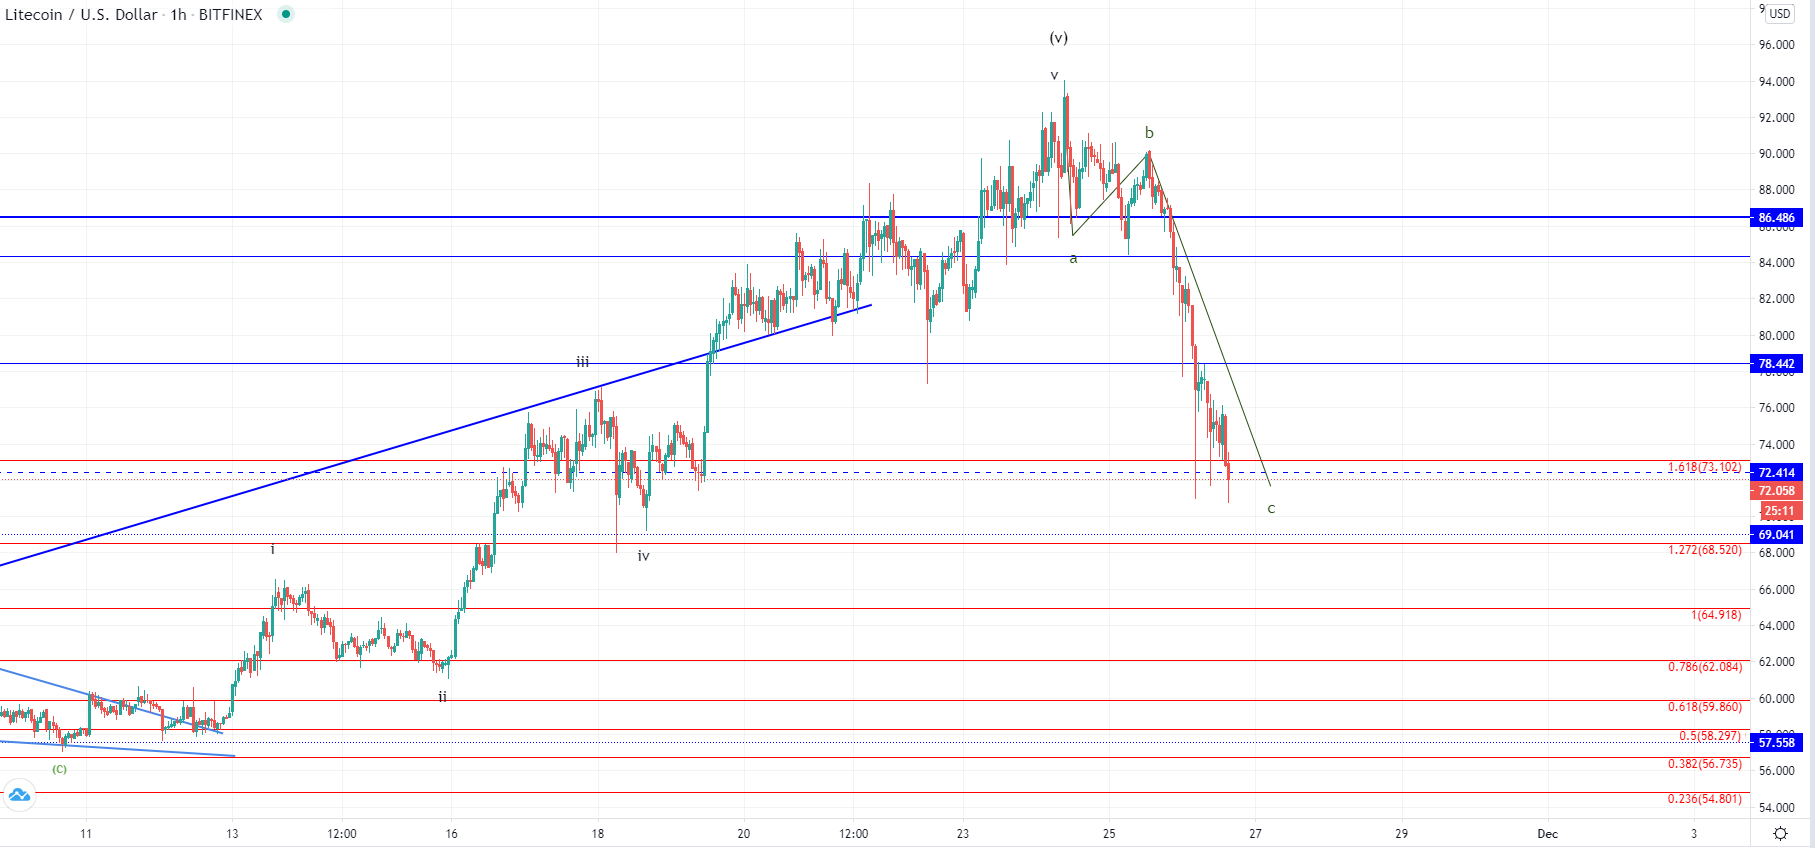
On the hourly chart, you can see that the price made its yearly high above the significant horizontal level at $86.48 on Tuesday which was the completion of the 5th wave out of the five-wave impulse to the upside. The lower level at around $84 is the one that represents the previous highest peak of the year made in February. The one at $86.48 is the resistance level which served as support in August 2019, below which the price broke and was below ever since.
Now as the price revisited that level again and made a slight peek into the seller’s territory it was pushed back to the downside indicating that the sellers are very much still present at those levels. We have seen a three-wave decrease to the 1.681 Fib level where it might find support. Another possibility could be that the price has started its higher degree correction out of which we are to see a five-wave move being the A wave from the higher degree. In that case, the recovery that would be expected after the current decline ends would be corrective and another impulse to the upside would develop after.
EOS/USD
From yesterday’s high at $3.89 the price of EOS has decreased by 26.24% today, coming to $2.88 at its current point which is the lowest. Like in the case of Litecoin the price is still in a steep downward trajectory, set to make new lows before the end of the day.
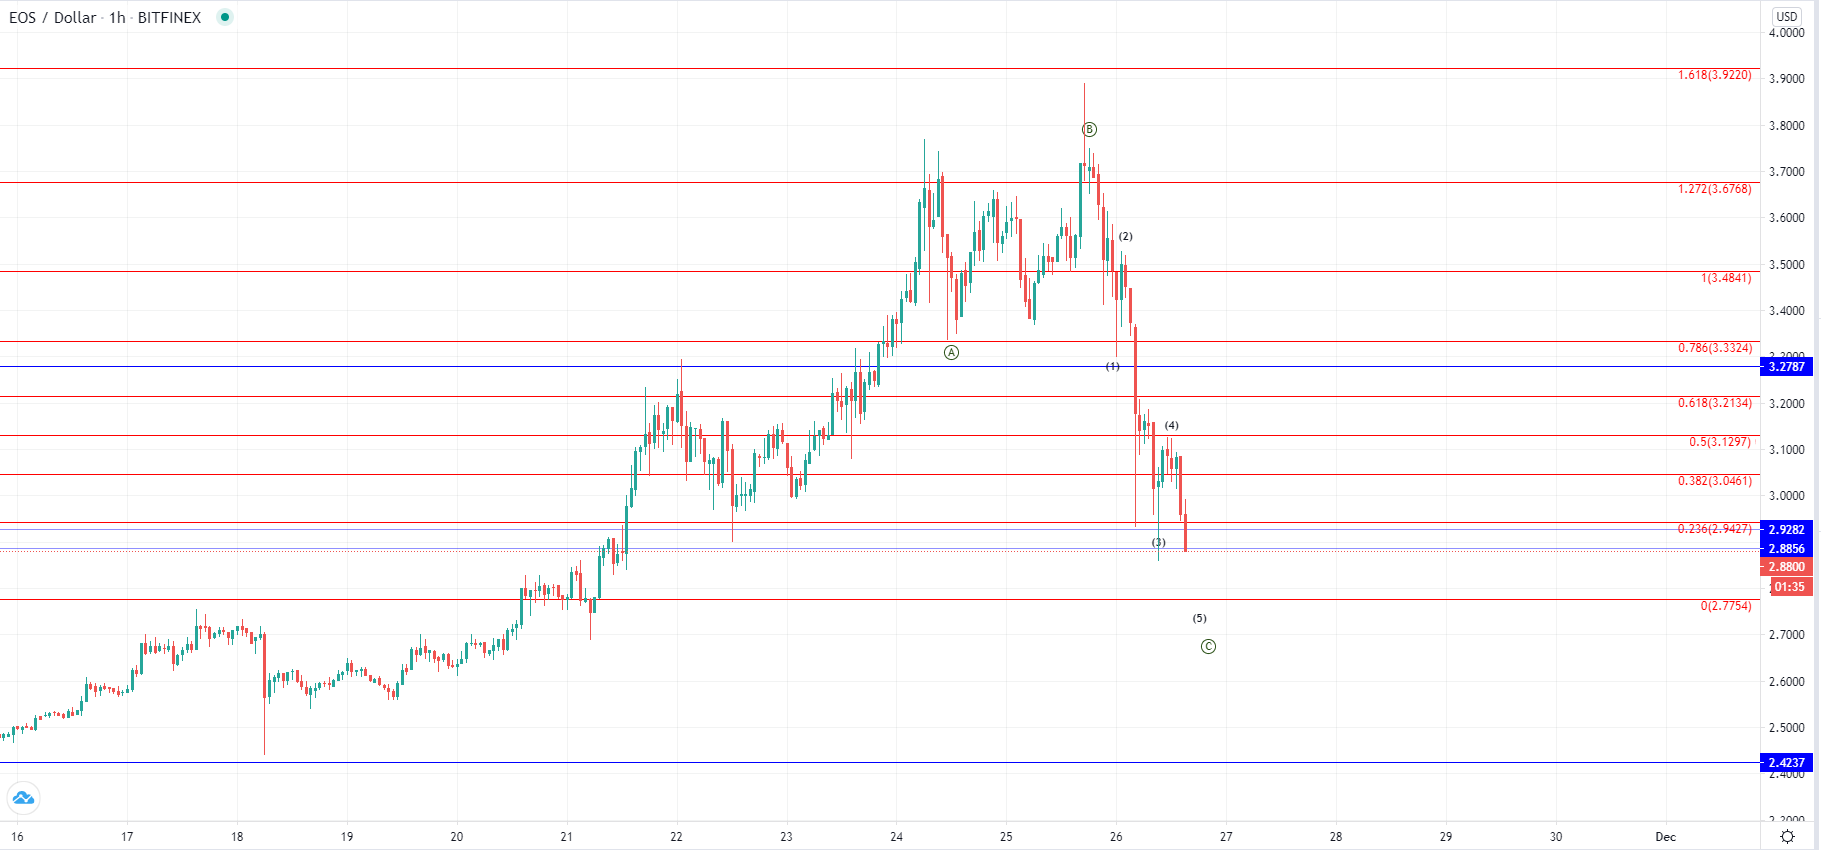
The hourly chart is showing strong seller’s pressure has been applied since yesterday after the price reached a slightly higher high than that on Tuesday when the first significant decline was made. We have seen sideways movement since Tuesday with the spike to the upside above the 1.272 Fib level and close to the next in line at around the $3.9 mark. Since the selling got activated the price made an impulsive move to the downside in a five-wave manner going below the 0.236 Fib level and is now interacting with the minor $2.88 one.
We are seeing the ending wave developing from the five-wave impulse which is most likely the C wave from the higher degree corrective count but further decline looks likely before its completion. Considering the vicinity of the 0 Fib level we might see a continuation of this descending move to it for interaction before its completion, which would lead the price to $2.775.
FXOpen offers the world's most popular cryptocurrency CFDs*, including Bitcoin and Ethereum. Floating spreads, 1:2 leverage — at your service. Open your trading account now or learn more about crypto CFD trading with FXOpen.
*At FXOpen UK and FXOpen AU, Cryptocurrency CFDs are only available for trading by those clients categorised as Professional clients under FCA Rules and Professional clients under ASIC Rules respectively. They are not available for trading by Retail clients.
This article represents the opinion of the Companies operating under the FXOpen brand only. It is not to be construed as an offer, solicitation, or recommendation with respect to products and services provided by the Companies operating under the FXOpen brand, nor is it to be considered financial advice.
Latest articles

Turtle Trading: System, Rules, and Strategy
In the 1980s, the Turtle Trading system was born from a debate about whether trading skills were innate or could be taught. Richard Dennis and William Eckhardt decided to train novices in their trend-following trading strategies, thus giving rise to

Trend Reversals and the Sushi Roll Reversal Pattern
Understanding trend reversals is essential for optimising trading and managing risks. This article delves into the concept of trend reversals, with a focus on the Sushi Roll reversal pattern—a sophisticated tool that helps traders anticipate significant market shifts—exploring

Rivian Stock Goes High as Q1 Report Anticipation Mounts
Being a newcomer within a very long-established and somewhat traditional global industry is not easy.
The automotive industry is a case in point. It has been over 139 years since Karl Benz managed to successfully produce the first motorised vehicle,