


FXOpen

LTC/USD
The price of Litecoin has been on the rise since Tuesday when it came down to $104.9 at its lowest point. From there we have seen an increase of 27% as it reached $133.3 at its highest point today. Currently, it is trading slightly lower but is still in an upward trajectory.
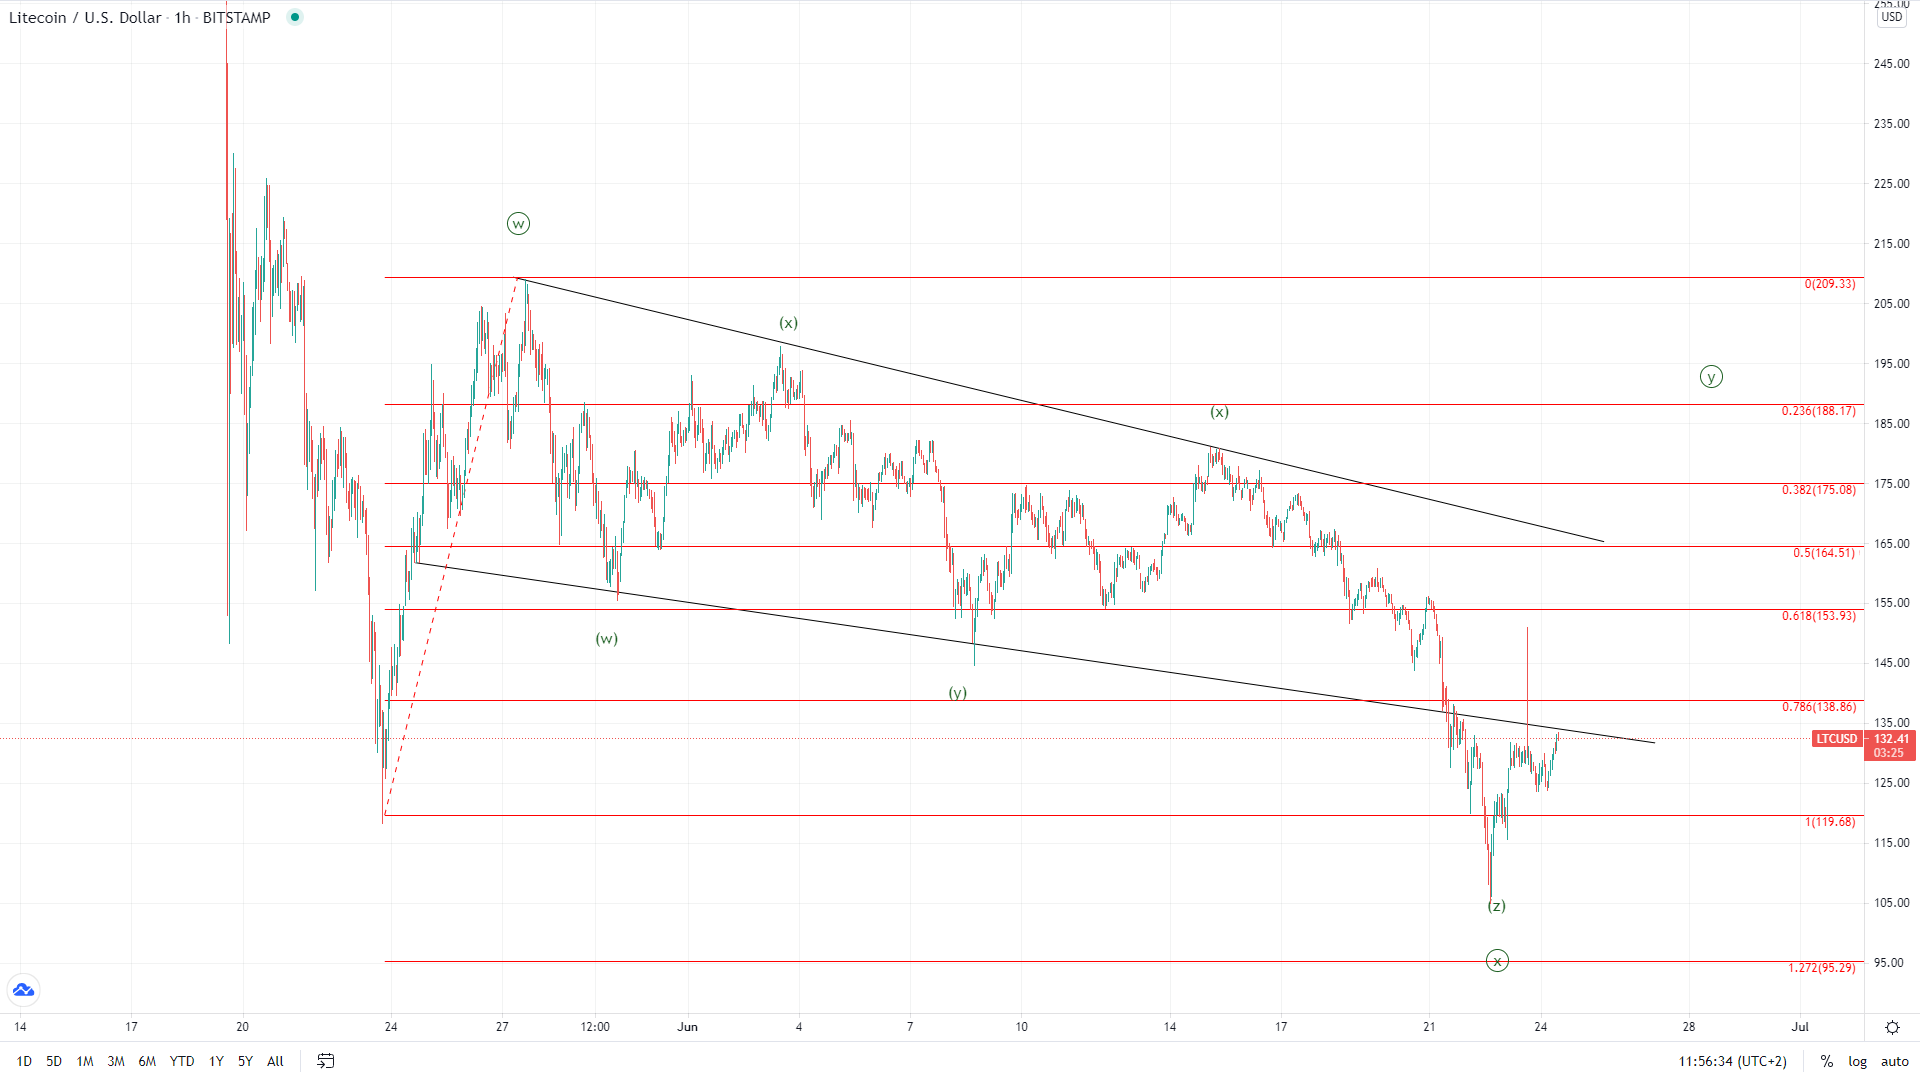
On the hourly chart, we can see that the price fell into a lower low compared to the May 23rd one and spiked to the upside, reaching the broken downtrend support which is being now tested for resistance. If the price finds resistance here another move to the downside would be expected, but only as a pullback before further upside continuation. This is so because on the 22nd we have most likely seen the end of the corrective five-wave move from the 27th of May so now a move to the upside like it developed from the 23rd till the 27th would be expected.
The price could now increase as much as 35% but it would be expected to go lower than on the 27th when it came up to $209. This is because the price made a lower low which is why a lower high would be more likely. Another possibility could be that we have seen the start of a completely new impulse wave to the upside and that the 22nd of June’s low was the completion of the higher degree down move. But this is going to be validated from the type of descending move we see after this expected rise.
EOS/USD
EOS was on a decline from the 15th of June when it was sitting at $5.384 and made a decrease of 42.6% measured to its lowest point on Tuesday at $3.08. From there we have seen an increase of 23.45% as its came up to $3.84 at its highest point today so far.
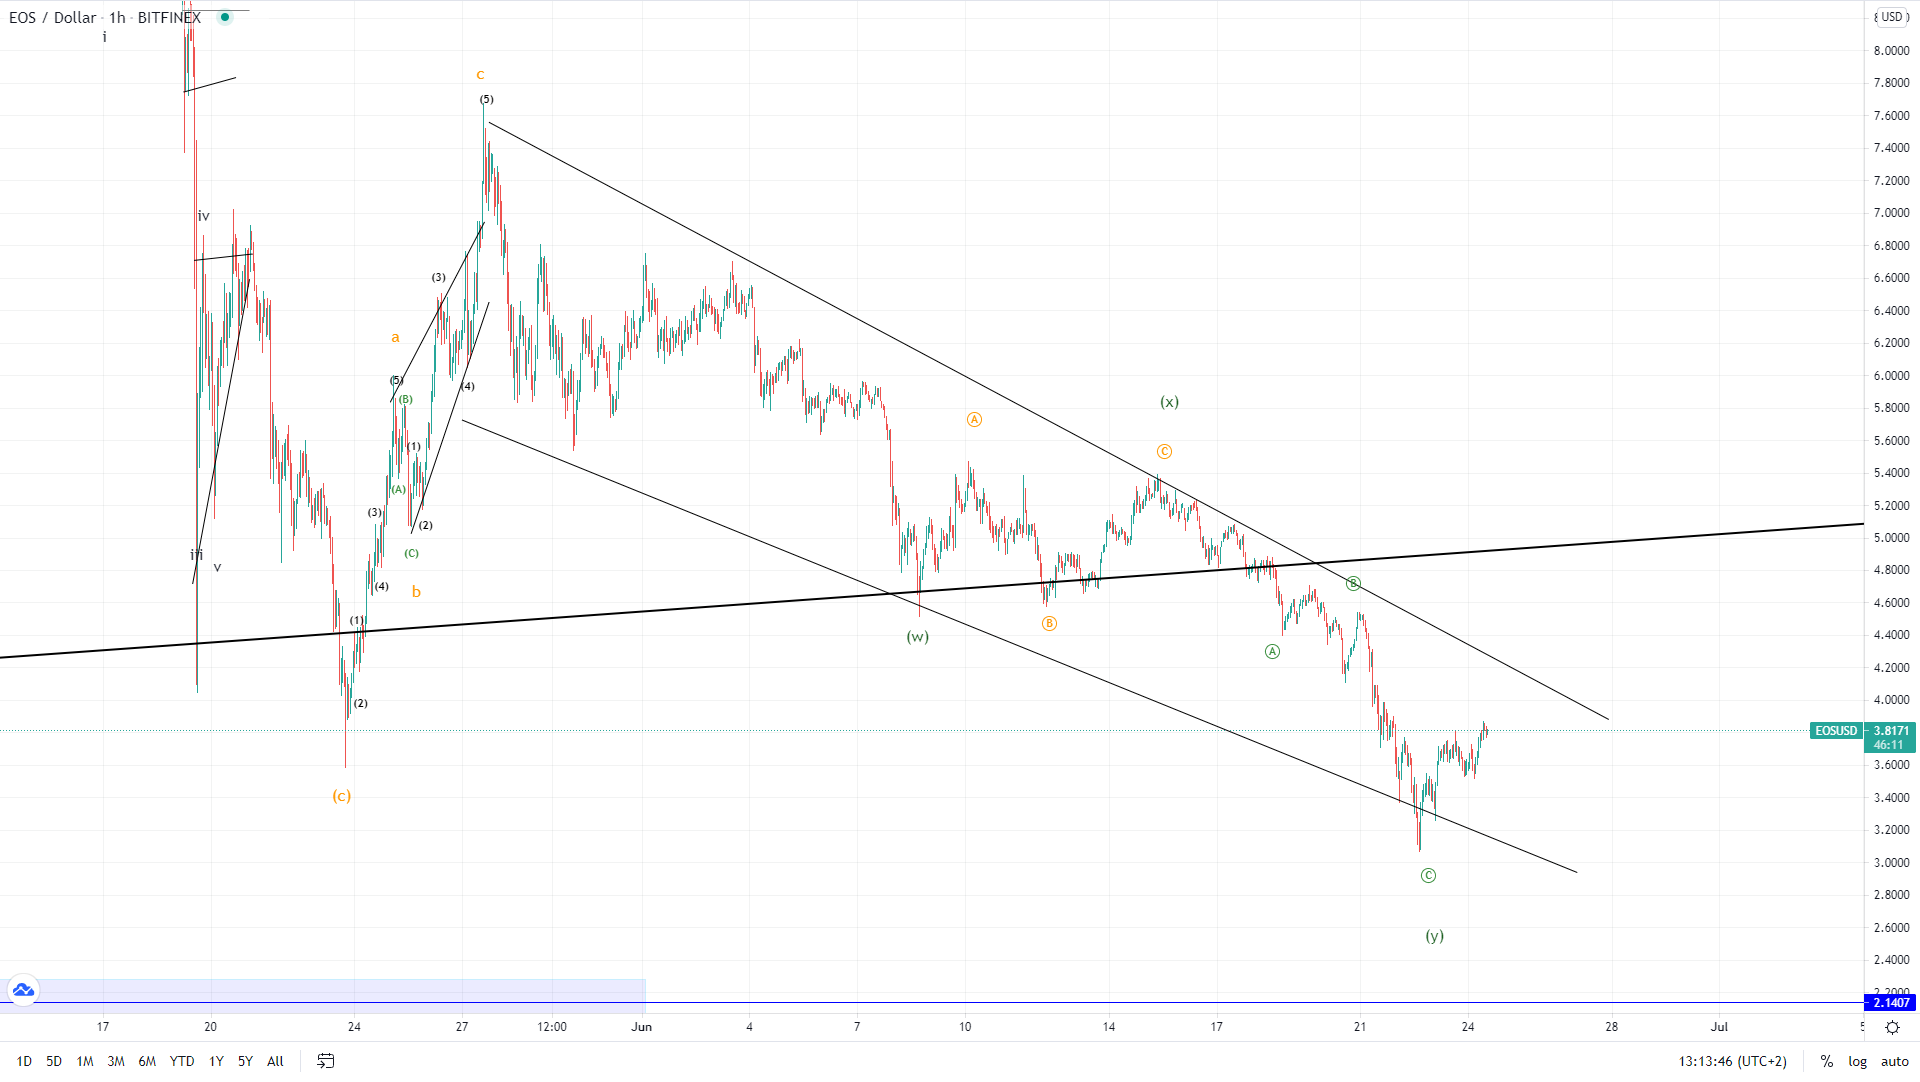 Tuesday’s low is most likely the end of the descending move from the 27th of May when we saw the initial recovery after a steep downfall on the 23rd. The price made a lower low which could now be the second sub-wave of the higher degree three-wave correction with another rise like from the 23rd till the 27th of May now taking place. Or it could be an ending point of the prior highest degree downtrend starting on the 12th of May when the price of EOS reached $14.8 which was it’s yearly high.
This forecast represents FXOpen Markets Limited opinion only, it should not be construed as an offer, invitation or recommendation in respect to FXOpen Markets Limited products and services or as financial advice. Cryptocurrency CFDs are not available to trade in all jurisdictions.
FXOpen offers the world's most popular cryptocurrency CFDs*, including Bitcoin and Ethereum. Floating spreads, 1:2 leverage — at your service. Open your trading account now or learn more about crypto CFD trading with FXOpen.
*At FXOpen UK and FXOpen AU, Cryptocurrency CFDs are only available for trading by those clients categorised as Professional clients under FCA Rules and Professional clients under ASIC Rules respectively. They are not available for trading by Retail clients.
This article represents the opinion of the Companies operating under the FXOpen brand only. It is not to be construed as an offer, solicitation, or recommendation with respect to products and services provided by the Companies operating under the FXOpen brand, nor is it to be considered financial advice.
Latest articles

How to Identify and Trade Liquidity Grabs
Understanding the intricacies of market liquidity and the role of liquidity grabs can be crucial for optimising trading strategies. Liquidity grabs, creating rapid price movements, are a key component of Smart Money trading. This article explores how to identify these

What Is a Piercing Line Pattern, and How Can You Trade with It?
In the world of technical analysis, the piercing line pattern stands out as a solid indicator of potential market reversals. This article delves into the nuances of this two-candlestick pattern, exploring its formation, significance, and how traders can effectively leverage

London Calling! FTSE 100 Stocks Flying High Once Again
Back in 2021, which when looking at a physical calendar does not seem such a long time ago yet feels like an epoch ago when considering the changes in global economies and the capital markets since then, the FTSE 100