


FXOpen

LTC/USD
On Monday the price of Litecoin has been traded at $55.617 as it managed to make up for some losses made on Sunday’s spiked to the $51.7 area and continued increasing until it reached $59.86 on the same day. From there we have seen another decrease with a higher low indicating an uptrend but then the price came up again to the same level and found resistance there making the same high for the 2nd time. Now the price is currently being traded at $58.159 as it made another higher low and is likely to break the prior resistance but we are yet to see if the increase occurs or have we seen the completion of the corrective upward move before another downturn.
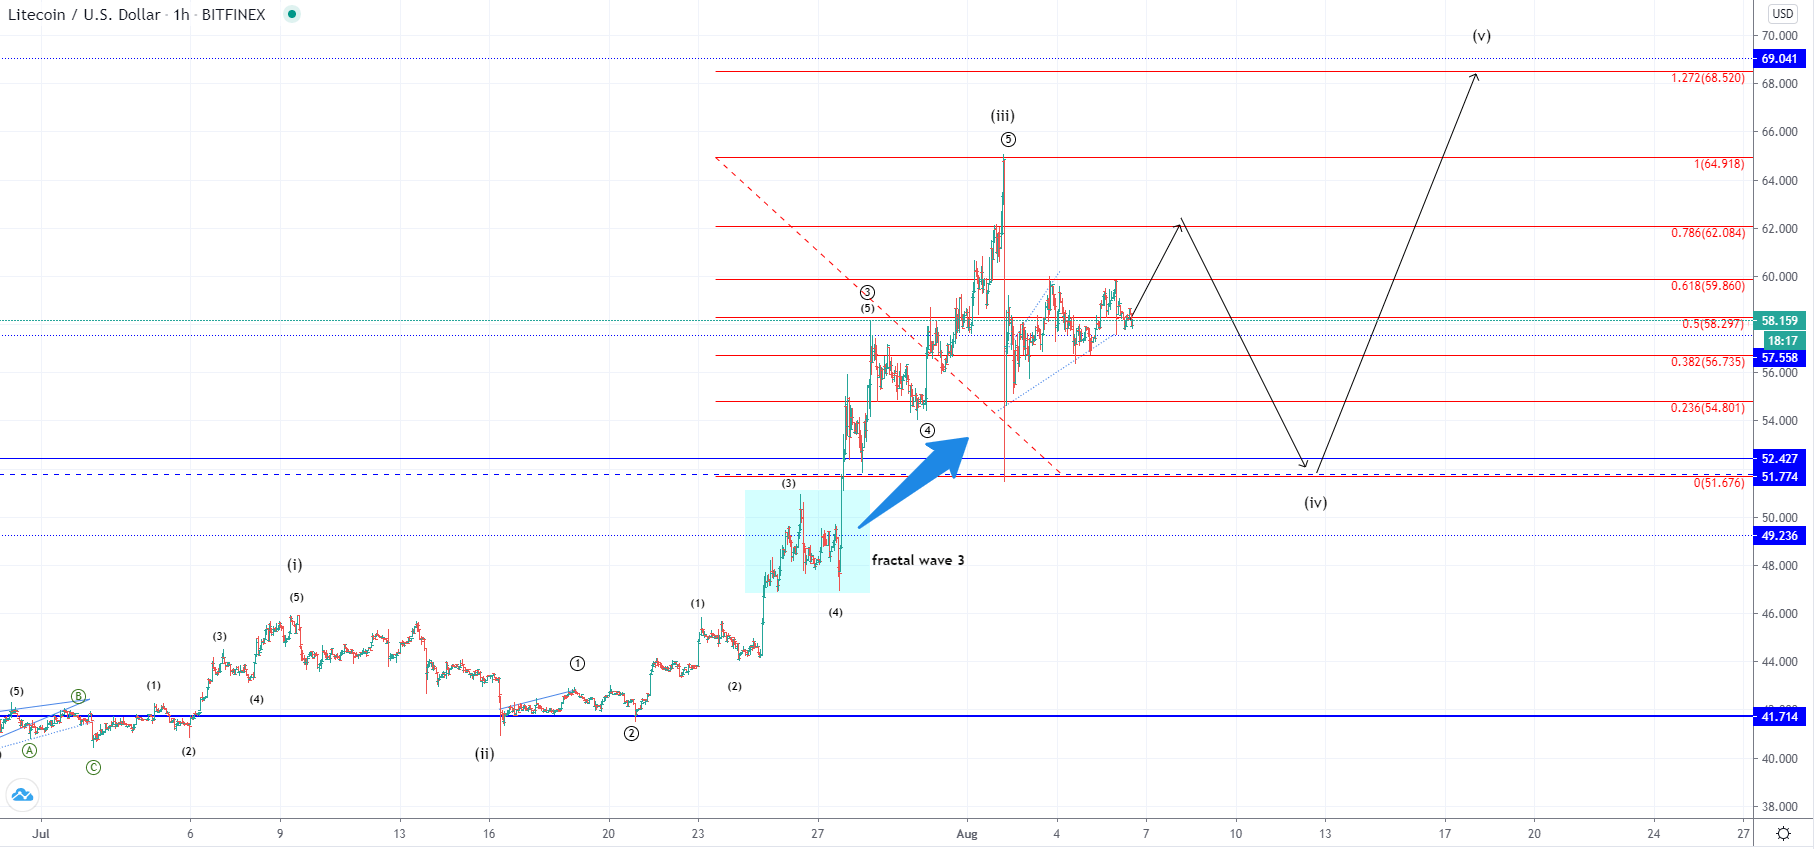
On the hourly chart, you can see that the price action made a similar fractal, like in the lower degree presumed 3rd wave from the prior count but already made a three-wave increase. If this was the completion of the corrective upside movement ending on the 0.618 Fibonacci level then we are currently seeing the 2nd wave out of the next move to the downside with the price continuing its downfall shortly.
However, more likely we are yet to see the development of the 3rd wave out of the corrective upside move as the one prior to this was a minor degree count in which case a higher high to the 0.786 Fibonacci level would be expected. But as this is considered the wave 4 of a higher degree count when it ends another impulsive move to the downside would be expected similar to one we have seen on Sunday.
EOS/USD
The price of EOS has impulsively fallen on Sunday following the market’s movements and has made a slight recovery since but hasn’t managed to make up much of the loss like the other cryptos did and especially the major ones. It was being traded at $2.92 on Mondays and from there made an increase of 6.54% coming to $3.11 at its highest point. From there we have seen a continuation for the sideways movement as it broke out from the local ascending channel and is now hovering around its medial point at $3.

On the hourly chart, we can see that the price has made a corrective sideways movement with the wave structure implying its potential completion. This is why in the case of EOS we can see that the market has corrected after an impulsive move to the downside and it has a high probability of another impulsive decrease coming shortly after. If the price correction ended on the Y wave from the lower degree count we could be seeing the beginning of the next move to the downside but another possibility would be that further corrective upside movement will be seen before this occurs.
Unlike in the case of Litecoin where this expected impulse to the downside is labeled as the 4th wave of a higher degree on the price chart of EOS I have presented a different outlook in which could have seen a potential ending of the bullish impulse and an even higher degree move to the downside starting in which case the expected impulse would be its 3rd wave out of the five-wave move. That means that we can potentially see the development of the downtrend from here but this is to be validated from the momentum behind the expected price decrease.
FXOpen offers the world's most popular cryptocurrency CFDs*, including Bitcoin and Ethereum. Floating spreads, 1:2 leverage — at your service. Open your trading account now or learn more about crypto CFD trading with FXOpen.
*At FXOpen UK and FXOpen AU, Cryptocurrency CFDs are only available for trading by those clients categorised as Professional clients under FCA Rules and Professional clients under ASIC Rules respectively. They are not available for trading by Retail clients.
This article represents the opinion of the Companies operating under the FXOpen brand only. It is not to be construed as an offer, solicitation, or recommendation with respect to products and services provided by the Companies operating under the FXOpen brand, nor is it to be considered financial advice.
Latest articles

Anchored VWAP and How You Can Use It in Forex Trading
In the world of forex trading, understanding the nuanced tools at your disposal can significantly enhance decision-making processes. One such sophisticated tool is the Anchored Volume-Weighted Average Price (Anchored VWAP), which refines the standard VWAP by allowing traders to set

META Share Price Collapses after Publication of Quarterly Report
Just yesterday, META's stock price closed at USD 493.50, up approximately 40% since the start of 2024 and up nearly 300% since the start of 2023.
However, following the release of Meta's quarterly report, its shares plummeted to USD

USD/JPY Analysis: The Rate Exceeds The Level of 155 Yen Per US Dollar
Today, the price of USD/JPY once again renewed its 34-year high, exceeding the level of 155 yen per dollar, which put pressure on the current authorities.
According to Reuters, officials are trying to maintain calm in the market.
"We