


FXOpen

LTC/USD
Last week, on Wednesday, September 23rd, the price of Litecoin came down to revisit the September 21st low area and was coming to around $42.5. Since then we have seen the formation of the ascending channel in which the price has been bouncing and now again came to its resistance level for a higher high. At the moment it is being traded at $47.9 which is slightly below todays high but is showing strong bullish momentum as the majority of the increase occurred in two hours.
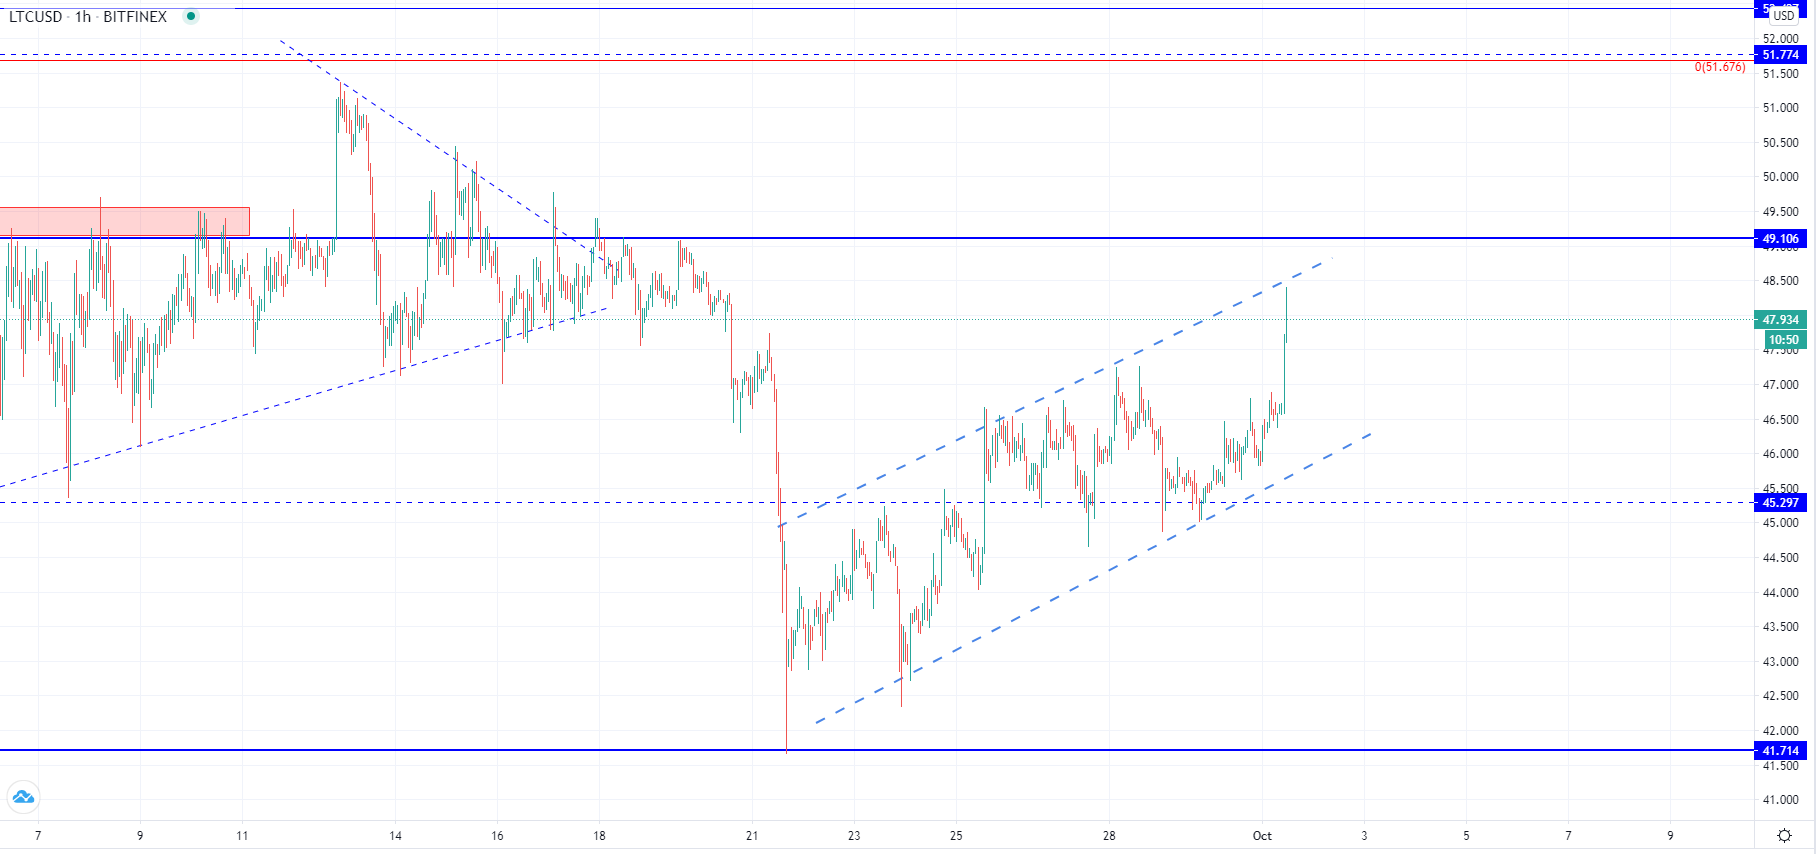
On the hourly chart, we can see that the price still hasn’t come to test the significant horizontal resistance point at around $49.1 but interaction is likely to occur shortly as it came above the minor horizontal level at around $47. A pullback might happen before the expected interaction in which case another retest of the ascending channels support level could be seen, but considering that the price has surpassed the $45.3 level it could find support around $46 area.
If the price starts moving to the downside again and starts going below the ascending channel’s support it can likely find it at the $45.3 level but if it continues moving below it, it would indicate that the channel structure was corrective in nature. However, more likely, we are to see an uptrend continuation and a breakout to the upside.
EOS/USD
The price of EOS has increased by 2.6% from yesterday’s low at $2.56 measured to its highest point today at $2.627 around which it is currently being traded.
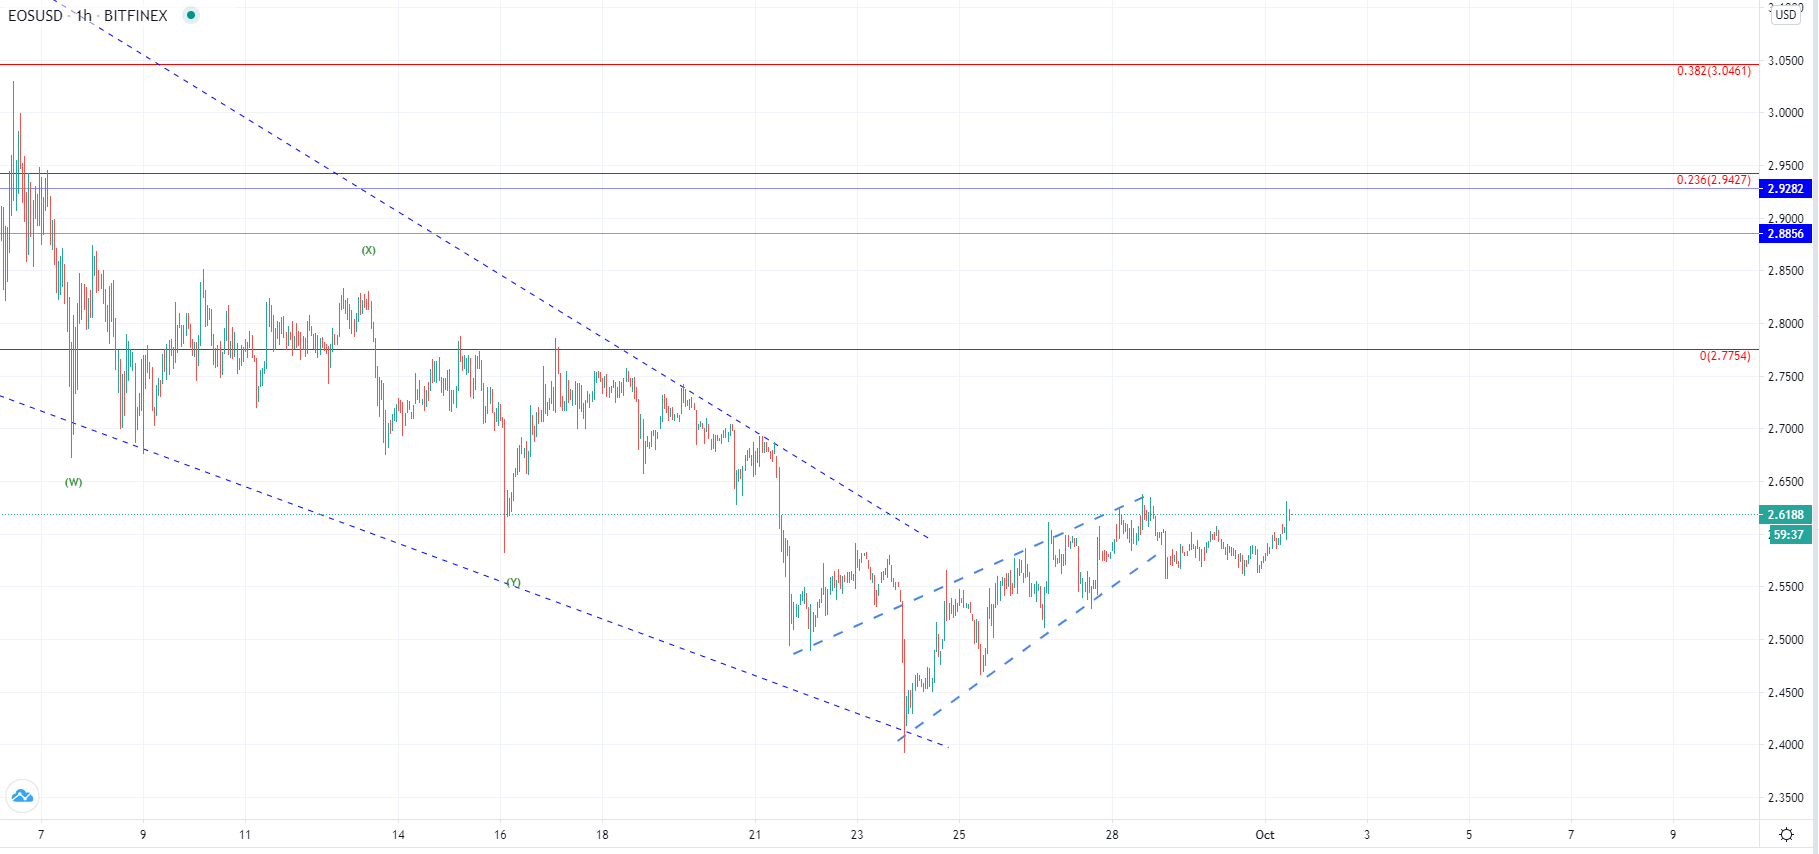
Looking at the hourly chart, you can see that a breakout was made from the descending triangle that was a dominant structure throughout most of September which could be interpreted as a bullish sign. The price increase from $2.39 on September 23rd to $2.635 level which was an increase of 10.12%. This high area is revisited today and we are yet to see if the price finds resistance there again like on Monday when the interaction with the area caused a minor pullback.
This minor pullback has made a horizontal support level above $2.56 which is an indication that the buyers are providing the support there, and with the ascending move that followed that the buying has been activated. Will this be enough to surpass the seller’s threshold we are yet to see, but if this ascending move is the continuation of the breakout momentum it is highly likely that the increase will continue.
The currently tested area is the previous horizontal support level validated on the 16th of September and now serves as resistance which is why its surpassing would indicate that the price increase is in a sustainable trend.
FXOpen offers the world's most popular cryptocurrency CFDs*, including Bitcoin and Ethereum. Floating spreads, 1:2 leverage — at your service. Open your trading account now or learn more about crypto CFD trading with FXOpen.
*At FXOpen UK and FXOpen AU, Cryptocurrency CFDs are only available for trading by those clients categorised as Professional clients under FCA Rules and Professional clients under ASIC Rules respectively. They are not available for trading by Retail clients.
This article represents the opinion of the Companies operating under the FXOpen brand only. It is not to be construed as an offer, solicitation, or recommendation with respect to products and services provided by the Companies operating under the FXOpen brand, nor is it to be considered financial advice.
Latest articles

Gold Price Reaches Historic High
According to confirmed information, Iranian President Ebrahim Raisi, considered a potential successor to the country's supreme leader, Ayatollah Ali Khamenei, died in a helicopter crash in a mountainous area near the border with Azerbaijan. The helicopter also carried Foreign Minister

Commodity Currencies Retreat from Local Highs
Despite the cooling labour market in the US and declining inflation, the American currency continues to move towards new highs. For instance, the USD/JPY currency pair might update the current month's high at 156.70, the NZD/USD sharply

What Is a BTST Strategy, and How Does One Trade It?
BTST (Buy Today, Sell Tomorrow) is a popular short-term trading strategy where traders buy shares one day and sell them the next to capitalise on overnight price movements. This article delves into the mechanics of BTST, its advantages and risks,