


FXOpen
LTC/USD
Over the course of the last seven days, the price of Litecoin has increased by 24% as it went from $33.5 on last Thursday to $48.87 at its highest spike on last Friday but has since come down to and is currently sitting at $41.8.
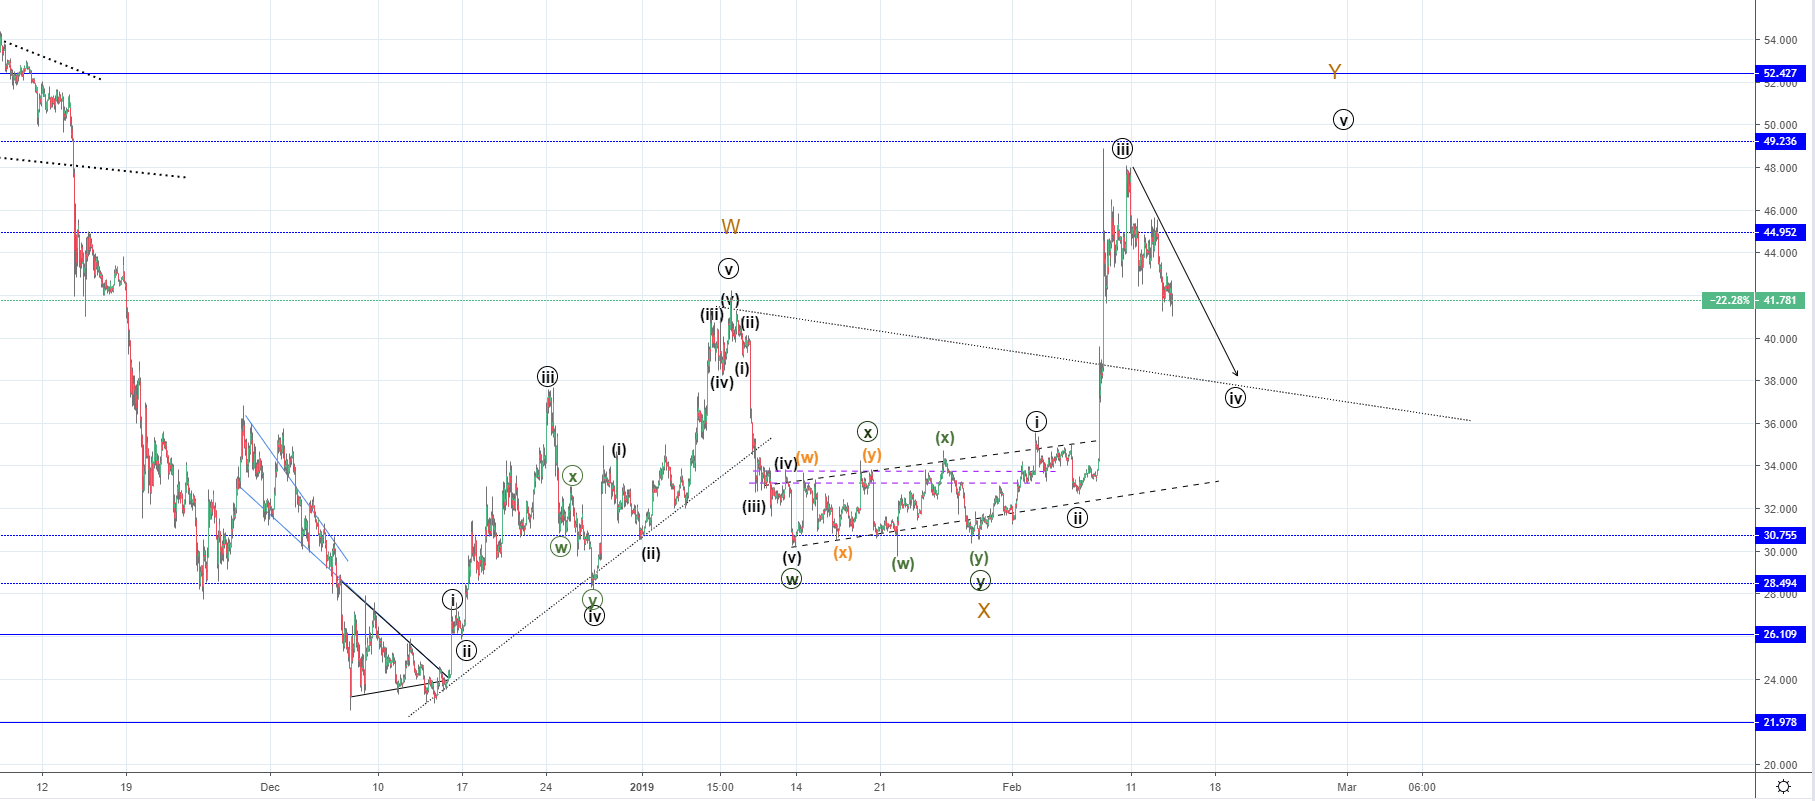
On the hourly chart, we can see that the price broke out from the ascending channel on the upside with strong momentum last Friday. The wave structure implies that this is the continuation of the increase we have seen started in December last year when the price of Litecoin came up from $23.3 to $42, which has been labeled as the W wave and is the first wave out of the correction to the upside labeled as the Minor WXY.
The current increase would be the wave Y out of that count, but as you can see most likely the increase hasn’t ended as I have counted only 4 waves with the current retracement being the 4th. The price could go back to the $35.5 where the ending point of the first wave is before continuing its upward trajectory for another high above the previous one at $48. However I don’t believe that the price is going lower than the still unconfirmed minor descending trendline, which was broken on the way up which would be around $37.9.
The other possibility is that the Y wave ended as a three wave move to the upside in which case what we are currently seeing is the start of another downtrend. But judging by the wave structure and the price action I primarily think that this is a retracement before further upside.
EOS/USD
The price of EOS has also experienced an increase over the last week and came up from $2.36 to $3.04 on Friday’s high and has retraced since and is currently sitting at $2.7983, which is an overall increase of 18.31%.
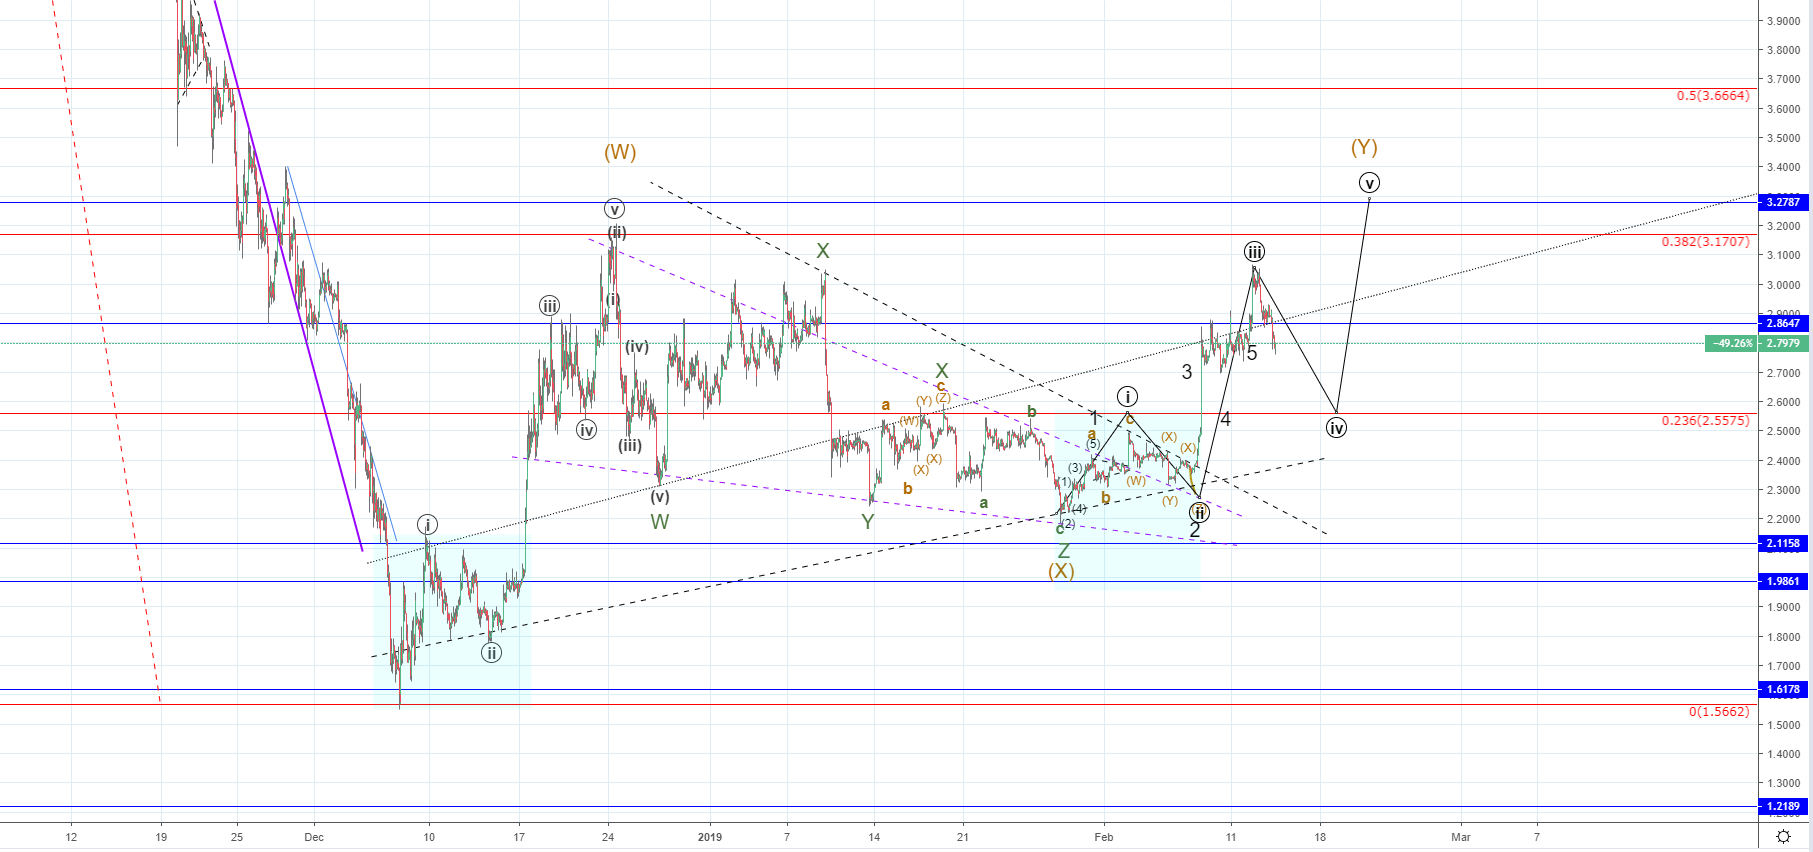
On the hourly chart, we can see a similar pattern like in the case of LTC as the market is strongly correlated. The price has broken the resistance line off of the falling wedge where it was correcting from 24th of December. But it has been stopped out at the resistance found around the ascending channel’s upper line at the vicinity of the first X wave from the Minor WXYXZ correction.
Like in the case of Litecoin, the wave structure implies that another move to the upside should be expected after the current retracement ends for a higher high compared to the one labeled as the Intermediate W wave (orange). The current retracement needs to end at first so I would look out for interaction with some of the support levels potentially around 0.236 Fibonacci level before the expected 5th wave starts developing.
The price target for the mentioned 5th wave and the end of the WXY correction would be slightly higher than 0.382 Fibonacci level, but it could very well end there as the 3rd wave ended lower.
FXOpen offers the world's most popular cryptocurrency CFDs*, including Bitcoin and Ethereum. Floating spreads, 1:2 leverage — at your service. Open your trading account now or learn more about crypto CFD trading with FXOpen.
*At FXOpen UK and FXOpen AU, Cryptocurrency CFDs are only available for trading by those clients categorised as Professional clients under FCA Rules and Professional clients under ASIC Rules respectively. They are not available for trading by Retail clients.
This article represents the opinion of the Companies operating under the FXOpen brand only. It is not to be construed as an offer, solicitation, or recommendation with respect to products and services provided by the Companies operating under the FXOpen brand, nor is it to be considered financial advice.
Latest from Cryptocurrencies
Latest articles

Since the Start of the Week, Brent Oil Price Has Dropped over 4%
At the beginning of the week, March 15, we wrote that the price of Brent oil could form a correction from the resistance level of USD 91 per barrel. Since then, the price has decreased by more than 4% due

Fair Value Gaps vs Liquidity Voids in Trading
Understanding fair value gaps and liquidity voids is essential for traders seeking to navigate the complexities of the financial markets. These concepts, deeply rooted in the Smart Money Concept (SMC), provide valuable insights into the dynamics of supply and demand,

UK100 Share Index Rises as UK Inflation Slows
Yesterday, the UK Office for National Statistics (ONS) reported that the CPI stood at 3.2% in March. According to ForexFactory, analysts expected 3.1%, and a month ago the index was 3.4%.
Grant Fitzner, chief economist at the