


FXOpen
The market is a part of nature, as it is produced by the interaction of traders. In other words, it is a reflection of human nature. So it is not a strange creature, or a mysterious place. Since both the markets and the traders are parts of nature, they subject to the simple laws of nature. When we envision the market as a composite of all the traders, we are acknowledging the market's important communication function. Human reads and speaks English or any other language, but what is the language of the market?
Basically, one bar or candle on any market chart is the basic unit of trading. Each bar gives us important information which is time, price, and volume.

Time is the particular period of trading through which one bar is formed, such as hour, day, week, etc… For example, a 1-hour bar represents trading activities through one hour period, and a day bar represents trading activities through a day period.
Price includes Open, High, Low, and Close (OHLC). It is important to understand the relationship between ‘the open’ and ‘the close’ when compared to ‘the high’ and ‘the low’ of the present bar. But, first you should know the fact that the market's main task is to find a balance point, and it always searches for and finds this balance point to define the exact price, where there is an absolute balance between the power buyers and sellers. Balance point will only move when there is a bias of buy or sell orders.
What does ‘the open’ say?
‘The open’ tells us where the balance point between buyers and sellers was at the opening of a period. Then we can see what will happen in the market throughout this time period by examining the movement of the balance point.
What does ‘the high’ say?
‘The high’ tells us the highest point to which the power of buyers moved the price. The bulls (buyers) obviously want to raise the price higher than the top of the bar, so that they could make more profit. But, the bulls run out of steam and the bears (sellers) become strong enough to stop the advance. This point is vital and important to the bears, because they are losing money on every tick of an ascending market.
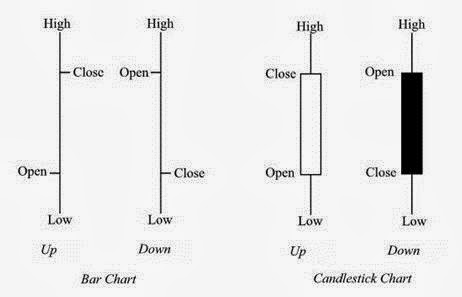
What does ‘the low’ say?
‘The low’ tells us the lowest point to which the power of sellers moved the price. The bears obviously want the price to go lower than the bottom of the bar, so that they could make more profit. But, the bears run out of steam and the bulls become strong enough to reject their downward momentum. This point is vital and important to the bulls, because they are losing money on every tick of a descending market.
What does ‘the close’ say?
‘The close’ tells us where that the balance point was at the end of the period. And this point will detect the nature of action and movement during the past period.
Volume is the pulse of the market, and the key for every movement. Volume refers to tick volume which is the number of price changes made during a specified period. It is not the number of contracts traded. However, there is no big difference between tick volume and actual volume relationship. When the present bar has more tick volume than the previous one, this means that more orders are coming to the market. Changes in volumes make changes in momentum, and, finally, changes in trend.

By the previous information, we can realize that the interaction between buyers and sellers moved the balance point around during the period. We can also know who is in charge during this period, and what are they doing. For example, when the balance point is higher at the end of the period than the opening, this means that buyers were in charge, and buy orders were more than sell orders. This is about trading activities in one bar, but to determine the trend, we need more than one bar.
Now, I will show pairs of bars, and compare the present bar to the previous bar in order to determine the immediate trend. As we see in the following image, the trend is up, in case of the midpoint of the current bar is above the top of the previous bar. The trend is not clear in case of the midpoint is inside the range of the previous bar. The trend is down in case of the midpoint is below the range of the previous bar.

It is important to emphasize that each change of direction in the market is a decision point. As before a trend can start, there is an increase in momentum, and before that, there is an increase in volume which is a result of traders' decisions. Actually, traders' decisions are made by changes in their minds.
Let's say now that the market can only talk about itself, as the only language the market speaks is time, price, and tick volume. Ticks will always tell how the market feels.
The article is written by Ahmed Mohamed and is participating in the Forex Article Contest. Good luck!
This article represents the opinion of the Companies operating under the FXOpen brand only. It is not to be construed as an offer, solicitation, or recommendation with respect to products and services provided by the Companies operating under the FXOpen brand, nor is it to be considered financial advice.
Latest articles

Since the Start of the Week, Brent Oil Price Has Dropped over 4%
At the beginning of the week, March 15, we wrote that the price of Brent oil could form a correction from the resistance level of USD 91 per barrel. Since then, the price has decreased by more than 4% due

Fair Value Gaps vs Liquidity Voids in Trading
Understanding fair value gaps and liquidity voids is essential for traders seeking to navigate the complexities of the financial markets. These concepts, deeply rooted in the Smart Money Concept (SMC), provide valuable insights into the dynamics of supply and demand,

UK100 Share Index Rises as UK Inflation Slows
Yesterday, the UK Office for National Statistics (ONS) reported that the CPI stood at 3.2% in March. According to ForexFactory, analysts expected 3.1%, and a month ago the index was 3.4%.
Grant Fitzner, chief economist at the