


FXOpen
Another good week for bitcoin as prices surge higher by $67 or just above 10 percent. Its little brother Litecoin is not doing as great however and is still fighting with the $4 resistance area. As usual we’ll start with bitcoin and go back to LTC later in the article.
Bitcoin Rally Hits $720
The bitcoin rally continues unabated as prices reached a new high at $720 today. But the road to here from last week’s print at $650 wasn’t smooth, as the chart below shows.
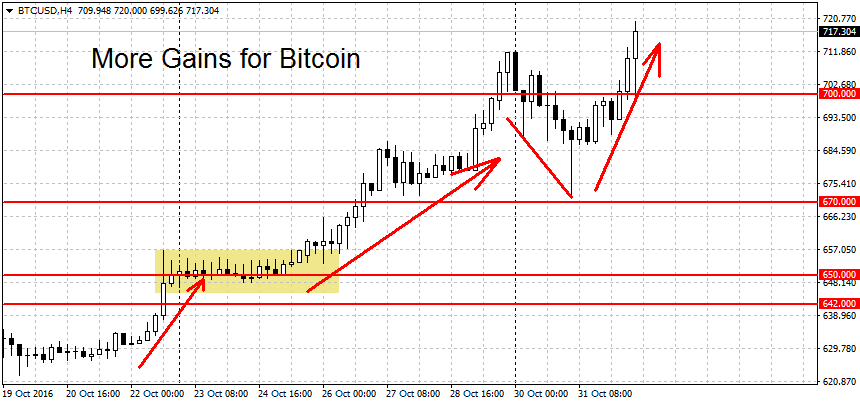
Last week we said that if the bulls manage to peel prices off the $650 mark, we have more resistance at $670 followed by $687 dollars .” The initial surge higher took BTC/USD to $686.899 (very close to the $687 resistance) but from here take-profit selling crashed prices down to the $670 mark. In a classic resistance-becomes-support, the $670 figure managed to hold the bear attacks and soon we were back to rallying higher.
Above current prices resistance can be found at $744 dollars (this year’s high on Fxopen), closely followed by the $750 round figure. But a much stronger resistance will be the multi-year high printed on other exchanges this year near the $800 handle.
On the lower end, the previous resistance levels at $650, $670, $687 and $700 should now act as support to falling prices. A decisive break below $640 would end the current short-term uptrend. Looking at the longer-term charts, bitcoin is trending higher on the weekly and the monthly as well.
Litecoin Fighting With $4 Resistance Area
Alternative crypto-currency Litecoin is still fighting with the $4 resistance area. Initially prices rallied as high as $4.03 on October 27th, only to be met with heavy selling. Two days later a second attempt was made with LTC peaking at $4.06 before retracing back below the $4 round figure.
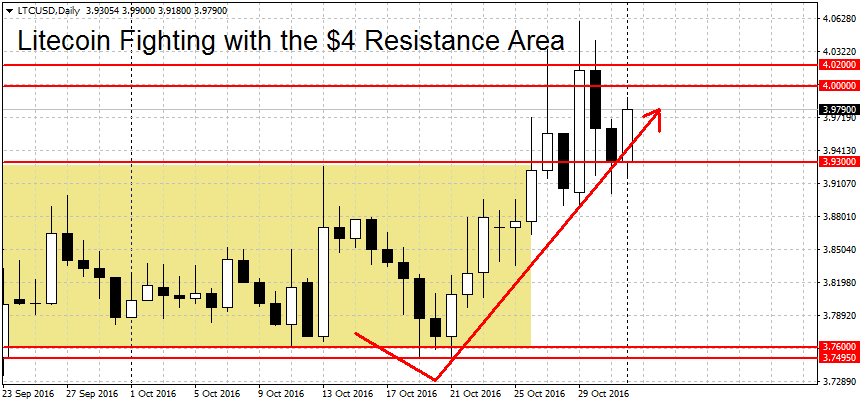
We’re currently quoted at $3.979 dollars per coin, meaning that the second bull attack was repelled as well. But the constant pushing on the highs and bitcoin’s bullish momentum could soon lead to a breakout higher. Conservative traders may want to wait for prices to clear the swing high at $4.07 before jumping in. As usual with these levels we’re looking for a sustained break, not just a brief shallow spike above the level.
If this resistance area is cleared, more levels can be found at $4.15, followed by a resistance area from $4.43 to $4.52 per coin. A breakout above here could lead to more gains. On the downside, a decisive break below the $3.7495 low would start a new downtrend. Notable support below here include the $3.69 swing low, the area around the $3.50 round figure and $3.22 per coin.
FXOpen offers the world's most popular cryptocurrency CFDs*, including Bitcoin and Ethereum. Floating spreads, 1:2 leverage — at your service. Open your trading account now or learn more about crypto CFD trading with FXOpen.
*At FXOpen UK and FXOpen AU, Cryptocurrency CFDs are only available for trading by those clients categorised as Professional clients under FCA Rules and Professional clients under ASIC Rules respectively. They are not available for trading by Retail clients.
This article represents the opinion of the Companies operating under the FXOpen brand only. It is not to be construed as an offer, solicitation, or recommendation with respect to products and services provided by the Companies operating under the FXOpen brand, nor is it to be considered financial advice.
Latest articles

Google Share Price Rose Post-market to a New All-time Record
Yesterday, after the close of the main trading session, a report on activities for the 1st quarter of Alphabet Inc. (Google's parent company) was published. The report was strong, exceeding investors' expectations.
→ Quarterly EPS = USD 1.89 (expected = USD 1.

S&P 500 Rebounds after Negative GDP News
Data released yesterday showed US GDP growth slowed to 1.6% in the first quarter of the year. According to ForexFactory: forecast = 2.2%, past value = 2.4%.
Reaction to the news sent the S&P 500 mini stock

GBP/USD And USD/CAD Daily Chart Outlook
GBP/USD is attempting a recovery wave from 1.2300. USD/CAD is consolidating and might aim for a move above the 1.3760 resistance zone.
Important Takeaways for GBP/USD and USD/CAD Analysis Today
· The British Pound started