


FXOpen
We have a mixed bag of results today. While Peercoin continues to clock gains, Namecoin finished its rally. It’s currently quoted at 25 cents, only 1.1 cents above the price noted two weeks ago.
Peercoin Rallies by 13 Percent
Peercoin prices are up by over 13 percent during the past 14 days, from $0.284 to 0.322 right now. As you can probably deduce from the chart below, the uptrend is still in place.
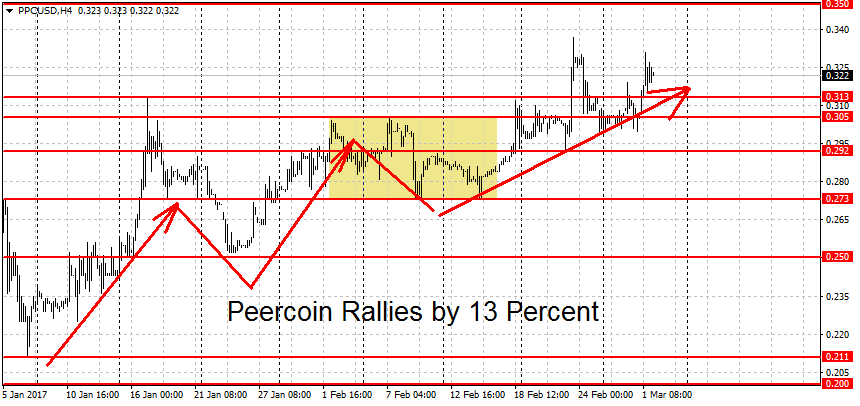
To end it, the bears will have to stage a decisive break of the $0.292 swing low. Support below here can be found at the $0.273 swing low followed by the $0.25 semi-round figure. Further down there’s a cluster of support levels around 20-21 cents. The $0.211 figure is the swing low for January, while $0.206 is last year’s low for PPC/USD. A clearing of this support area and a move below 20 cents could intensify the losses.
On the upper end, there’s weak resistance at this month’s high of $0.337. This is followed by potential resistance levels at 35 cents and the $0.388 swing high. Higher still there’s a few more notable levels at $0.40, $0.50 and $0.524 dollars per coin. On the weekly charts the trend has switched to bullish but on the longer-term monthly charts PPC/USD remains in neutral mode.
Namecoin Uptrend Ends
Namecoin started out similarly to PPC, rallying to a high of $0.284 dollars on February 24th. But here the fates of the two altcoins start to diverge as Peercoin resumes the move higher after a brief retracement while NMC/USD continues to lose ground.
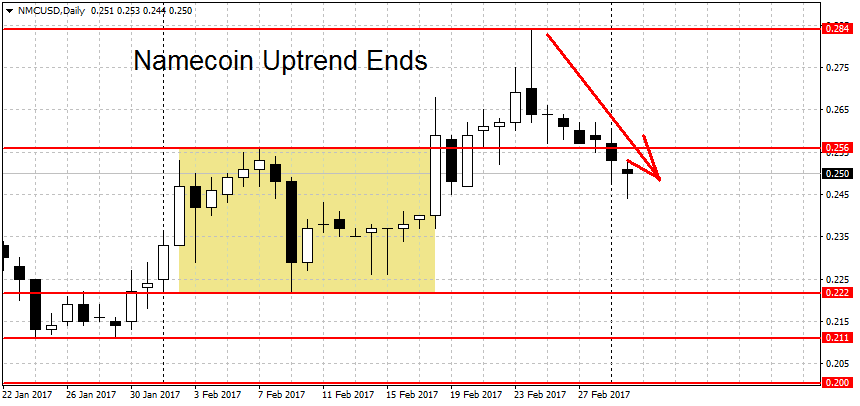
We are currently trading right at the 25 cents level, up by only 1.1 cents in two weeks. While this is a gain of over 4 percent, the large retracement from the highs signals that the uptrend is probably over. To resume it, the bulls will have to push this pair back above the $0.284 dollars swing high. Note that close to here we find three more resistance levels at the $0.292 swing high, the 30 cents round figure and the September resistance at $0.32 dollars. A clearing of this resistance area could see more NMC gains.
To start a new downtrend we need to see a break below the $0.222 swing low. We have support below here at the $0.211 swing low and the 20 cents round figure, closely followed by another swing low at $0.194 dollars per coin. Last December’s low at $0.162 is another noteworthy support level, as is last year’s low at $0.153. A breakdown below here could exacerbate the losses. The long-term charts for NMC/USD remain mixed, the weekly is neutral but the monthly chart is bearish.
FXOpen offers the world's most popular cryptocurrency CFDs*, including Bitcoin and Ethereum. Floating spreads, 1:2 leverage — at your service. Open your trading account now or learn more about crypto CFD trading with FXOpen.
*At FXOpen UK and FXOpen AU, Cryptocurrency CFDs are only available for trading by those clients categorised as Professional clients under FCA Rules and Professional clients under ASIC Rules respectively. They are not available for trading by Retail clients.
This article represents the opinion of the Companies operating under the FXOpen brand only. It is not to be construed as an offer, solicitation, or recommendation with respect to products and services provided by the Companies operating under the FXOpen brand, nor is it to be considered financial advice.
Latest articles

Google Share Price Rose Post-market to a New All-time Record
Yesterday, after the close of the main trading session, a report on activities for the 1st quarter of Alphabet Inc. (Google's parent company) was published. The report was strong, exceeding investors' expectations.
→ Quarterly EPS = USD 1.89 (expected = USD 1.

S&P 500 Rebounds after Negative GDP News
Data released yesterday showed US GDP growth slowed to 1.6% in the first quarter of the year. According to ForexFactory: forecast = 2.2%, past value = 2.4%.
Reaction to the news sent the S&P 500 mini stock

GBP/USD And USD/CAD Daily Chart Outlook
GBP/USD is attempting a recovery wave from 1.2300. USD/CAD is consolidating and might aim for a move above the 1.3760 resistance zone.
Important Takeaways for GBP/USD and USD/CAD Analysis Today
· The British Pound started