


FXOpen

Belonging to classic technical analysis patterns, wedges come in two shapes: rising and falling. The saying goes that a rising wedge is falling and a falling wedge is rising, highlighting the bearishness and bullishness of the pattern.
A wedge is a terrific reversal pattern. It forms when trends become exhausted, and can take some time until the market truly turns.
In technical terms, a wedge shows a series of marginal highs or lows. A rising wedge that appears at the end of a bullish trend is a series of higher highs and higher lows, with the price unable to advance much. In the case of a falling wedge, the series of lower lows is characteristic for the pattern. The price keeps falling but only makes marginal lows before, eventually, reversing.
Traders that use a pattern recognition approach are familiar with such reversal patterns. Just like head and shoulders or double and triple tops, wedges reverse even the strongest trends.
What is a Wedge?
When the price fails to continue in the direction of the underlying trend, a reversal is expected. The beauty of a wedge is that during the wedge formation the price leaves visible traces that help traders position for the big reversal.
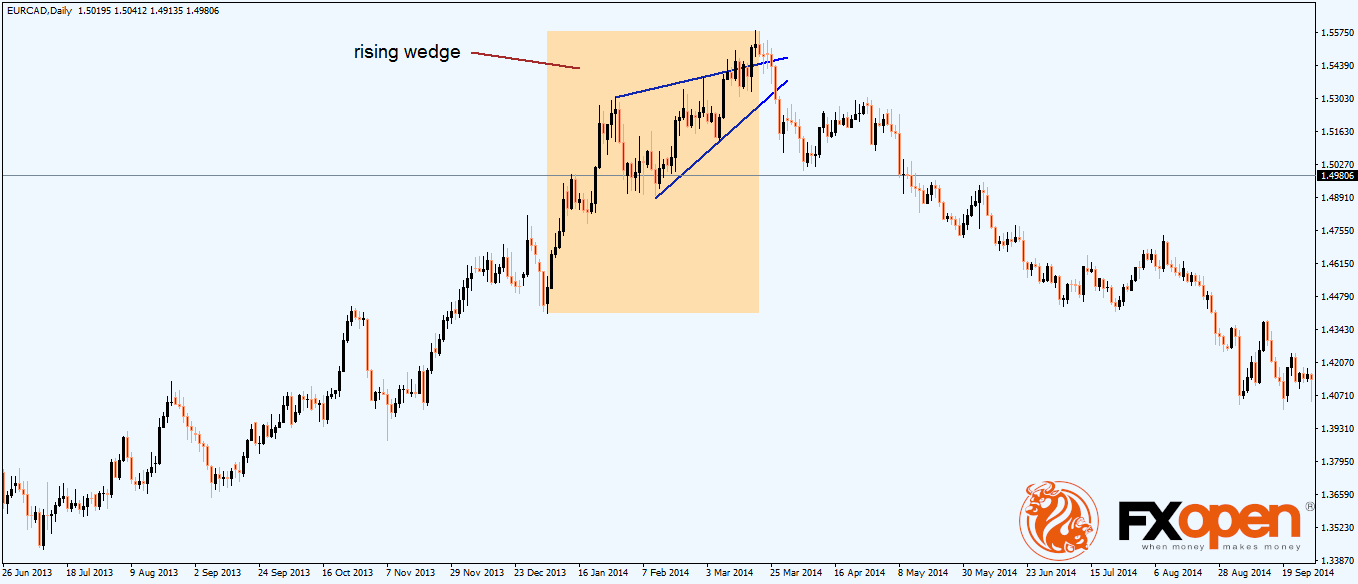
The EURCAD daily chart from above shows a rising wedge forming at the end of a bullish trend. As it can be seen, the price forms a series of marginal higher highs before reversing lower.
The shape of the wedge is given by its trendlines. Virtually always, the trendlines converge towards a common point, resembling a triangular formation.
How to Trade a Wedge
The easiest way to interpret a wedge is to label it appropriately. Traders use numbers to define the trendlines, with the focus being on the last swing higher.
Using numbers is a great way to make the most of its trendlines. The lower trendline (in a rising wedge) or the upper one (in a falling wedge) are the most important ones. They signal the end of the wedge formation and most of the times the price retest the trendlines. However, it isn’t mandatory to see such a retest, but if it forms, it is a great place to enter the market with a stop-loss at the highest or lowest point in the wedge.
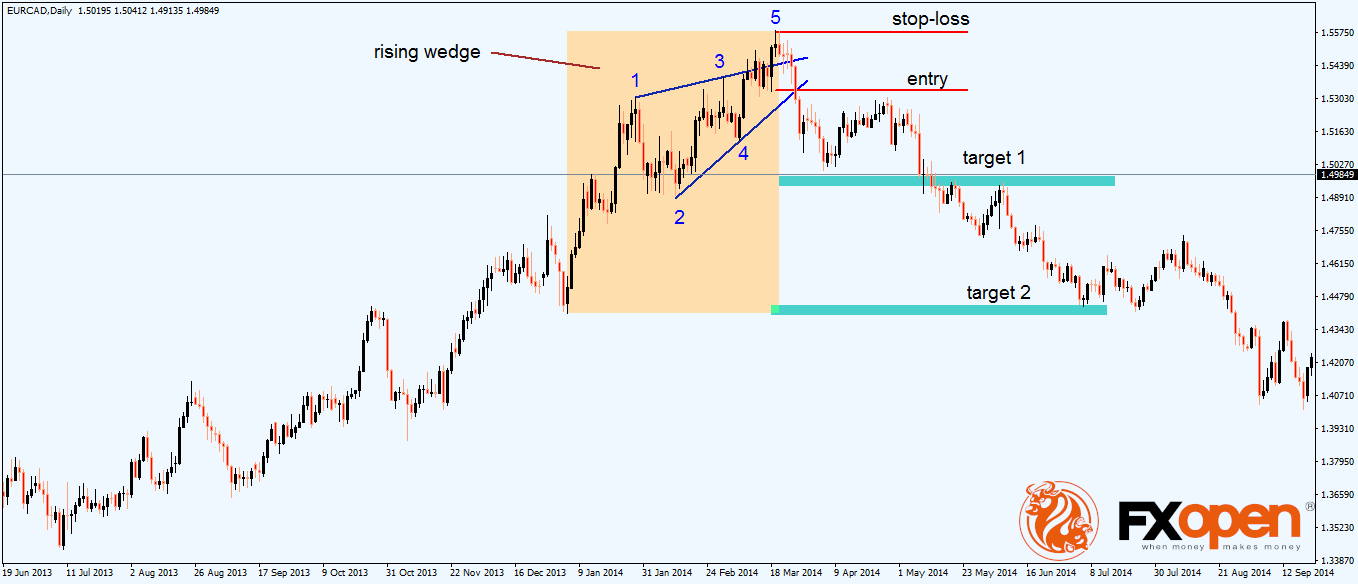
Trading a wedge is fairly simple. The 2-4 trendline’s break is the entry, while the stop-loss sits at the highs if we use the previous EURCAD example.
As for the target, traders use two targets, quickly adjusting the stop-loss by the time the price reaches the first target. The way to go is to move the stop-loss order to break-even when the price reaches the first target and let the price going for the final one.
Conclusion
Rising and falling wedges are strong reversal patterns. The higher the timeframe, the stronger the implications.
What’s beautiful is that the rules of trading a wedge remain the same, and the only thing a trader needs to do is to adjust the volume based on the timeframe the wedge appears on.
A wedge is even more powerful if it is part of a bigger degree reversal pattern. For instance, it may form as the second spike in a double top or bottom. Moreover, if other signs of a reversal appear (e.g. Japanese candlesticks reversal patterns like hammers, Doji candles, etc.), the trader gets a confirmation that a reversal is close.
This article represents the opinion of the Companies operating under the FXOpen brand only. It is not to be construed as an offer, solicitation, or recommendation with respect to products and services provided by the Companies operating under the FXOpen brand, nor is it to be considered financial advice.
Latest articles

Since the Start of the Week, Brent Oil Price Has Dropped over 4%
At the beginning of the week, March 15, we wrote that the price of Brent oil could form a correction from the resistance level of USD 91 per barrel. Since then, the price has decreased by more than 4% due

Fair Value Gaps vs Liquidity Voids in Trading
Understanding fair value gaps and liquidity voids is essential for traders seeking to navigate the complexities of the financial markets. These concepts, deeply rooted in the Smart Money Concept (SMC), provide valuable insights into the dynamics of supply and demand,

UK100 Share Index Rises as UK Inflation Slows
Yesterday, the UK Office for National Statistics (ONS) reported that the CPI stood at 3.2% in March. According to ForexFactory, analysts expected 3.1%, and a month ago the index was 3.4%.
Grant Fitzner, chief economist at the