


FXOpen
Price action trading refers to buying or selling a currency market or a market without using any technical analysis indicators. Only with the use of trendlines, traders identify support and resistance levels where the market is most likely to hesitate.
Because brokers offer various timeframes to analyze a market, support and resistance vary in importance. The rule goes that the bigger the timeframe, the stronger the support or resistance. Hence, the more difficult for the price to break it.
Two types of support and resistance exist: horizontal and dynamic. As the name suggests, horizontal support turns into resistance when the price breaks the horizontal level.
On the other hand, dynamic levels follow the price. They move together with the price action and are more difficult to overcome.
When two or more dynamic and horizontal levels appear on a chart, the area is called a confluence area. The price will have a difficult time getting through, a confluence
How to Build Support and Resistance
The easiest way to illustrate how support and resistance work is to use examples. In this case, we use the EURUSD weekly timeframe, with no indicators on it whatsoever.
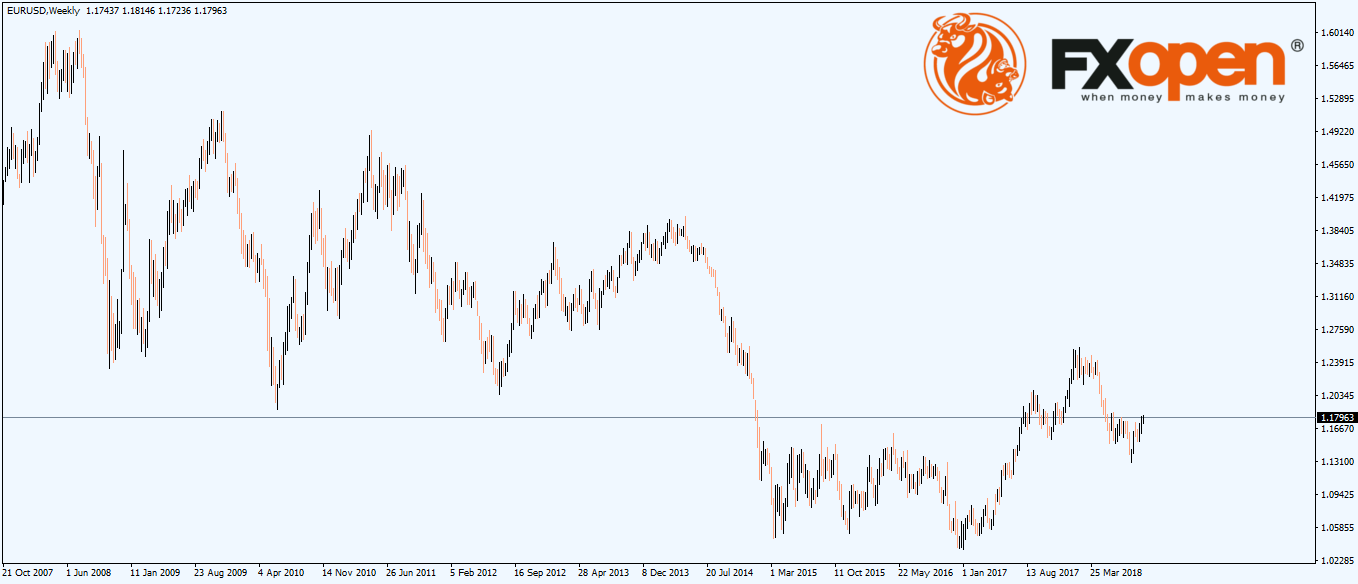
The price action during 2018 so far was mixed. The market rose from the 1.20 level where it ended the previous years, only to consolidate in a triangular pattern for over two months around the 1.25 mark.
For traders with a technical eye, it was tough for the bullish trend to continue. Chances were that the market would have a hard time advancing in the same direction as the price action reached tremendous resistance.
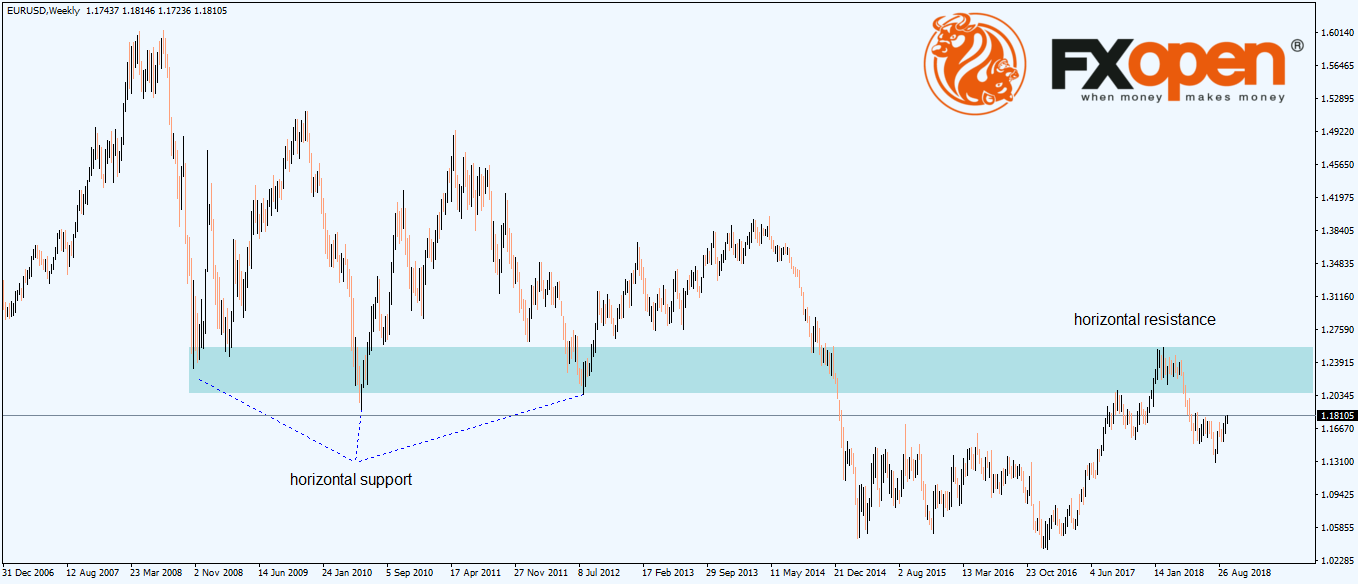
At first, the area where the recent 1.25 consolidation started, turned out to be a horizontal resistance. During the 2008 financial crisis reaction, the pair hesitated for several years before eventually broke below the horizontal support.
The logical step is that the next time it comes to support, it’ll meet stiff resistance.
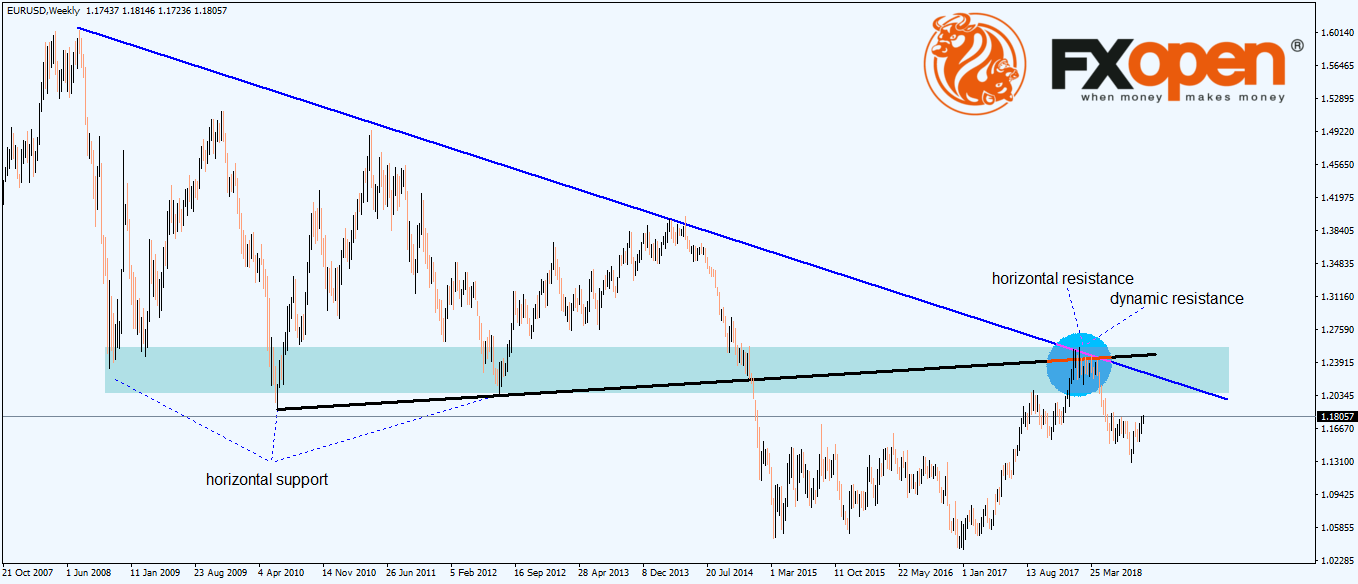
Second, if we draw a trendline connecting the previous lower high with the absolute high, we see a dynamic resistance coming at the same level.
Last but not least, the black trendline connects the support levels before the pair broke lower. A projection of it on the right side of the chart comes at the same resistance area.
In other words, we have a confluence area given by two dynamic resistance levels forming on top of a horizontal one. Add to this the weekly timeframe, and chances favored a rejection, rather than a continuation pattern.
Needless to say, the pair turned South, dropping over a thousand pips from the dynamic resistance. Savvy traders always put their money on the path of least resistance, and in this case, the downside was evident as they built the area using pure price action tools like horizontal and dynamic support and resistance levels.
Conclusion
These days, traders tend to overcomplicate things. Because trading platforms offer all kind of technical indicators, the temptation exists to use as many as possible.
However, it doesn’t mean that the forecast is more accurate. In fact, keeping things simple works all the time as the apparent areas become visible when using price action tools like support and resistance.
This article represents the opinion of the Companies operating under the FXOpen brand only. It is not to be construed as an offer, solicitation, or recommendation with respect to products and services provided by the Companies operating under the FXOpen brand, nor is it to be considered financial advice.
Latest articles

AUD/USD Rises Sharply on Inflation News
The Consumer Price Index for Australia was released this morning. According to ForexFactory:
→ CPI in quarterly terms: actual = 1.0%, expected = 0.8%, previous value = 0.6%;
→ CPI in annual terms: actual = 3.5%, expected = 3.4%, previous value = 3.

TSLA Share Price Up About 13% Despite Disappointing Report
Yesterday, TSLA trading closed at USD 144.68 per share, after which Tesla reported its results for the 1st quarter:
→ earnings per share: actual = USD 0.45, forecast = USD 0.49;
→ gross income: actual = USD 21.45 billion, forecast = USD

Market Analysis: Gold Price Corrects Gains While Oil Price Regains Strength
Gold price rallied above $2,400 before correcting lower. Crude oil price is rising and it could climb further higher toward the $85.50 resistance.
Important Takeaways for Gold and Oil Prices Analysis Today
· Gold price rallied significantly above $2,