


FXOpen

For most traders, riding a trend is the reason why they start trading in the first place. But in Forex trading, trends don’t form so often.
Statistically, the market spends most of the time in consolidation, with prices holding ranges over sixty-five percent of the time. This makes trend trading difficult and the focus shifts from a trend trading strategy to correctly spot when a trend starts and how long it lasts.
The currency dashboard is made of pairs that range more than others. For example, cross pairs (pairs that do not have the U.S. Dollar in their componence) range more than major pairs.
Hence, when looking for trend trading, the chances are that the U.S. Dollar based pairs will provide more opportunities than crosses.
What to Consider when Trend Trading
A trend is a directional move that a currency pair makes. Depending on the timeframe it forms, some trends are stronger than others.
Sometimes, all you need to do is to spot the right trend on the right timeframe and the entire trading year is saved. For example, the 2017 main trade was being long the EURUSD pair.
It broke higher after the French elections, and it didn’t stop until it reached the 1.20 level. Those missing the trend on the most important currency pair missed most of the price action for the entire year.
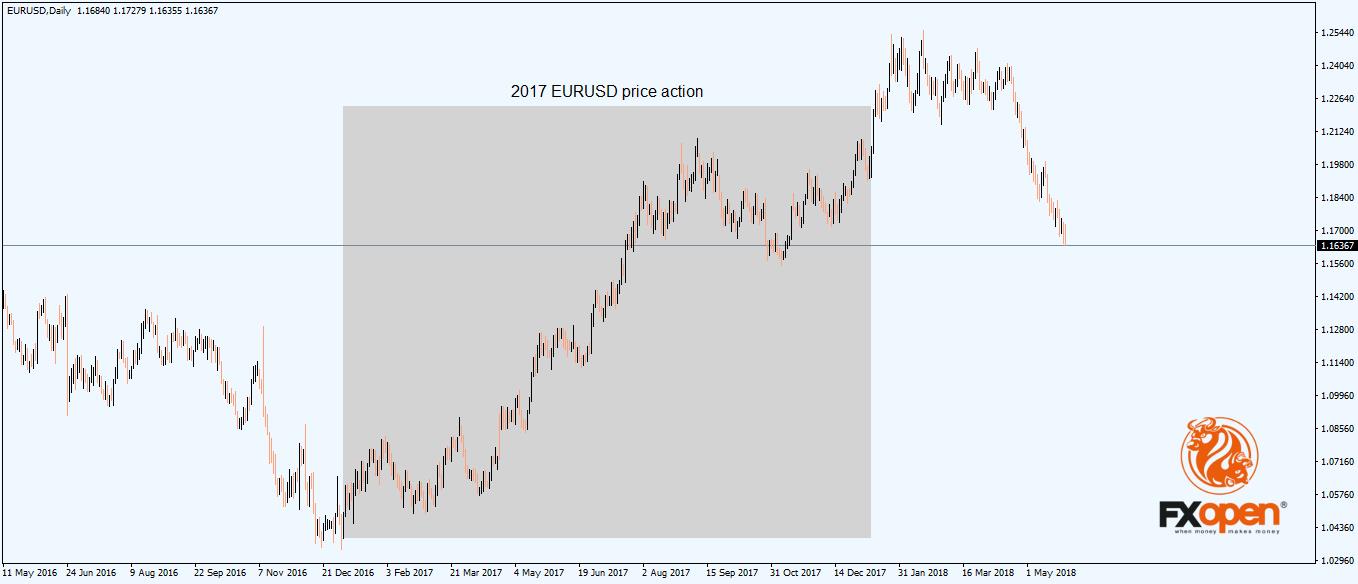
Because it formed on the daily chart, the trend was impossible to miss. Hence, every trader had the possibility to ride it and had plenty of time for the right positioning.
Here’s a list of things to consider when trend trading:
- look for a series of higher highs and higher lows (in bullish trends) to keep going
- look for a series of lower lows and lower highs (in bearish trends) to continue
- draw the dominant trendline by connecting the low (in a bullish trend) with the next higher low; in a bearish trend, connect the high with the next lower high
- even if the trendline breaks, the trend remains in place if the series of higher highs/higher lows or lower lows/lower highs is not broken
- adjust the trendline every time the market makes a new higher high (in a bullish trend) or lower low in a bearish trend
- project the dominant trendline from the previous trend’s lower highs or higher lows, to find potential dynamic support and resistance levels
Here’s how the EURUSD daily chart looks if following the rules explained above:

A simple, and yet efficient way to ride the perfect trend starts and ends with the series of lower lows/lower highs and higher lows/higher highs. Only after understanding this, traders are ready to ride any trend.
Conclusion
One of the biggest challenges to trading is to hold on to your winners. And, to cut losers as fast as possible.
The two are the main enemy to the success in Forex trading. When a position is in profit, the fear of losing kicks in and most of the retail traders fall to it. On the other hand, when the market goes against the desired direction, traders fail to cut the loss as quick as possible.
Applying the rules described here would help to increase the profitability of a trading account. Moreover, the chances of finding and riding the perfect trend increase too.
This article represents the opinion of the Companies operating under the FXOpen brand only. It is not to be construed as an offer, solicitation, or recommendation with respect to products and services provided by the Companies operating under the FXOpen brand, nor is it to be considered financial advice.
Latest articles

Anchored VWAP and How You Can Use It in Forex Trading
In the world of forex trading, understanding the nuanced tools at your disposal can significantly enhance decision-making processes. One such sophisticated tool is the Anchored Volume-Weighted Average Price (Anchored VWAP), which refines the standard VWAP by allowing traders to set

META Share Price Collapses after Publication of Quarterly Report
Just yesterday, META's stock price closed at USD 493.50, up approximately 40% since the start of 2024 and up nearly 300% since the start of 2023.
However, following the release of Meta's quarterly report, its shares plummeted to USD

USD/JPY Analysis: The Rate Exceeds The Level of 155 Yen Per US Dollar
Today, the price of USD/JPY once again renewed its 34-year high, exceeding the level of 155 yen per dollar, which put pressure on the current authorities.
According to Reuters, officials are trying to maintain calm in the market.
"We