


FXOpen

Moving Average is one of the most widely used tools in technical analysis. Although mostly traders have knowledge on what moving average is and how to use it but there are very few who actually know how to employ it for maximizing profits.
Basically moving averages give an average price of the underlying security over a period of time. Moving averages smooth out the market fluctuations and provide a filtered data. It helps in analyzing the price trend and gives even more reliable results when used in combination with other technical indicators.
Although it is a lagging indicator as it provides delayed signals i.e. a day or two after the market actually responds but still it can let you earn healthy profits.
Interpretation of Moving Averages
There are various techniques traders use to interpret the moving averages.
1. Comparing MA with the Price: The simplest interpretation involves comparing the moving average with the ongoing price of the security.
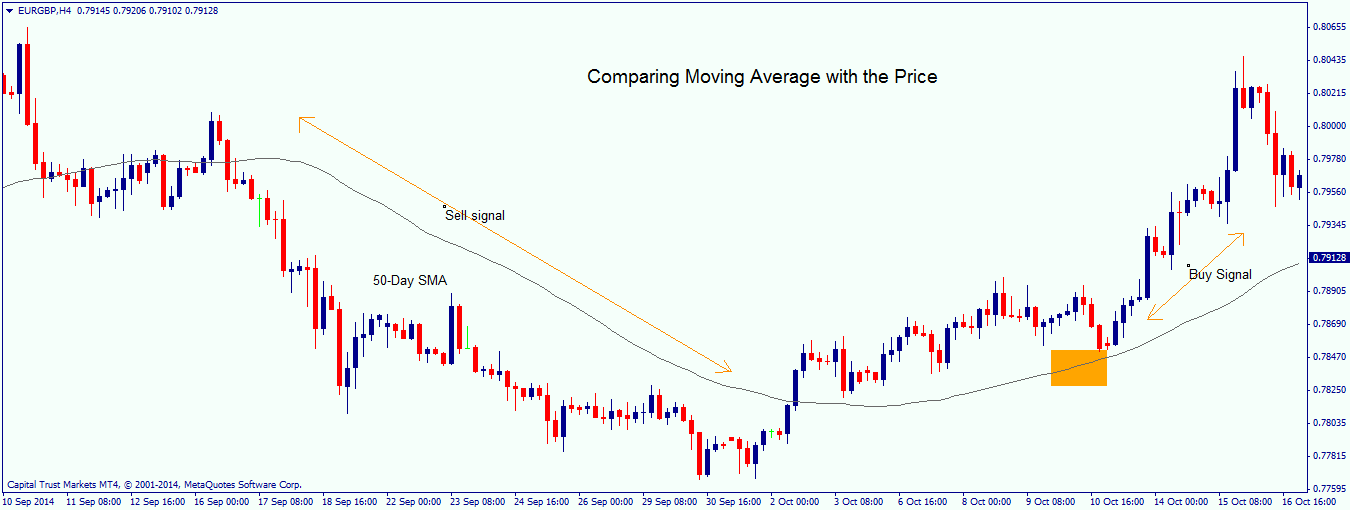
- A Buy signal is generated when the price is above the moving average.
- A Sell signal is generated when the price is below the moving average.
2. Using Two Moving Averages: This technique, also known as double cross-over, involves the use of two moving averages, one with a longer length and the other one with a shorter time period. This technique works well for the trending market.
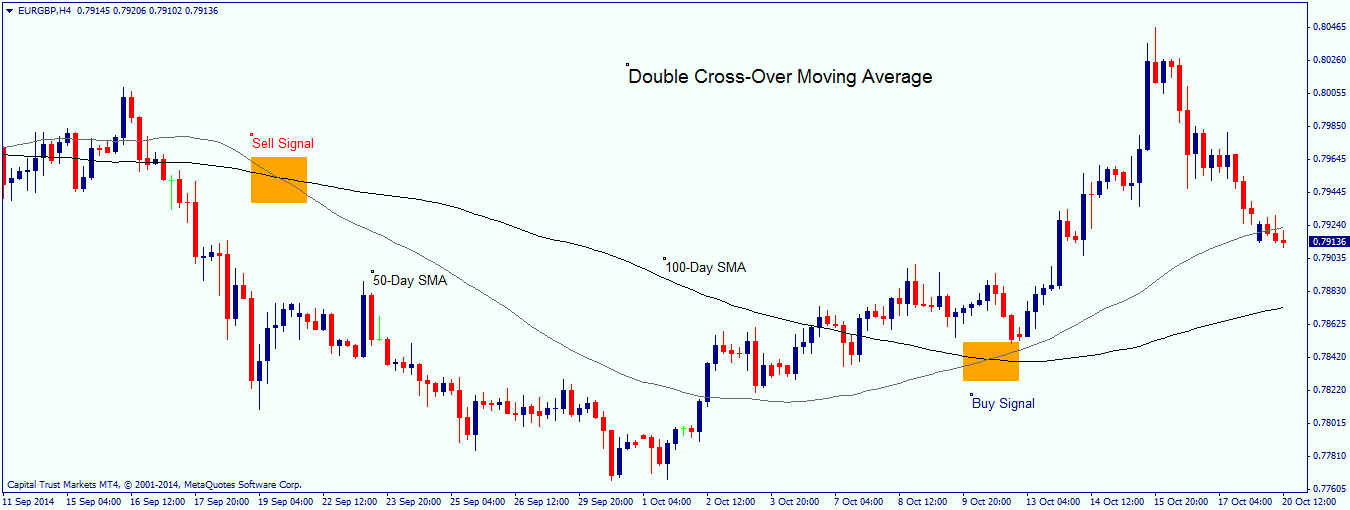
- A buy signal is there when the short-term MA crosses above the long-term MA, provided the long-term MA is rising. This is known as Golden Cross.
- A sell signal is there when the short-term MA crosses below the long-term MA provided the long-term MA is falling. This is known as dead cross.
Not to mention some traders also use triple crossover that involves the use of three moving averages.
This article represents the opinion of the Companies operating under the FXOpen brand only. It is not to be construed as an offer, solicitation, or recommendation with respect to products and services provided by the Companies operating under the FXOpen brand, nor is it to be considered financial advice.
Latest from Trader’s Tools
Latest articles

META Share Price Collapses after Publication of Quarterly Report
Just yesterday, META's stock price closed at USD 493.50, up approximately 40% since the start of 2024 and up nearly 300% since the start of 2023.
However, following the release of Meta's quarterly report, its shares plummeted to USD

USD/JPY Analysis: The Rate Exceeds The Level of 155 Yen Per US Dollar
Today, the price of USD/JPY once again renewed its 34-year high, exceeding the level of 155 yen per dollar, which put pressure on the current authorities.
According to Reuters, officials are trying to maintain calm in the market.
"We

Yen in Search of New Lows, Commodity Currencies at a low Start
In recent trading sessions, the dollar has been trading quite differently to leading currencies. Thus, the yen is reaching historical lows, European currencies have managed to correct, and the Australian and Canadian dollars are testing strategic supports.
USD/JPY
The