


FXOpen
Candlestick is one of the most popular price action patterns among retail forex traders. In this article we are going to discuss the ins and outs of candlestick pattern. There are some key candlestick candles that show continuity or reversal in the ongoing trends, let’s explain them briefly one by one:
Pin Bars
There are basically two types of pin bars, the bullish pin bar pattern, and bearish pin bar. A pin bar consists of large tail, head and a small nose on the top. The tail of pin bar should be at least twice the total length of the pin bar as demonstrated in the following diagram.
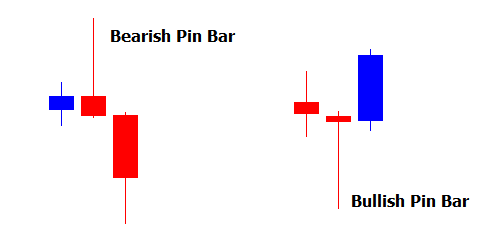
If a pin bar appears within a counter trend then it signals potential reversal while the emergence of pin bar within the same trend simply shows continuity of trend.
Engulfing Candles
The engulfing candles are also of two types, the bullish engulfing candle and bearish engulfing candle. An engulfing candle should completely engulf (cover) the preceding candle of an opposite trend as demonstrated in the following diagram.
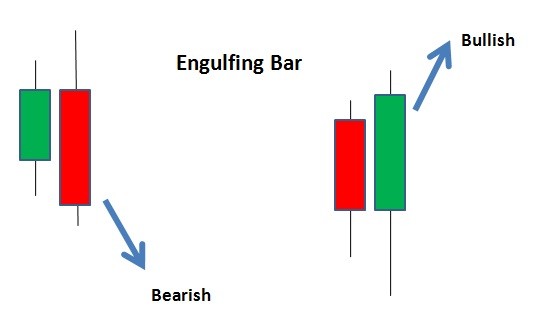
Engulfing candles are considered very strong signal for the continuity or reversal in the ongoing trend.
Hammer
A hammer pattern candle is very much similar to the bullish pin bar with just one exception that it doesn’t have any nose on the top as demonstrated in the following diagram.
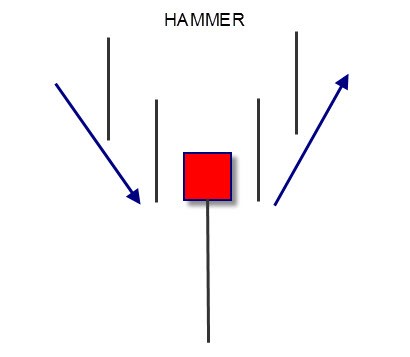
The head of the hammer can be either bullish of bearish. The tail should be twice the total length of the candle.
Shooting Star
A shooting start candle is similar to the bearish pin bar with an only exception of no nose at the bottom. It signals reversal if emerged within a counter trend while hints at continuity if emerged within the same trend.
Guidelines
There are a few guidelines that must be considered while trading the above mentioned candlestick candles:
- The candle must emerge near some key support or resistance area. The support and resistance levels can be calculated with the help of Fibonacci levels or trendlines.
- The candle should be considered legitimate if it is emerged around some key horizontal level or psychological level.
- A tight stop loss should be kept at the bottom or top of the candle depending on the trend while the take profit must not be less than 1.5 times of the risk involved.
- It is always recommended not to trade ahead of major releases such as monetary policy announcements, nonfarm payrolls, growth figures, unemployment data etc.
Conclusion
Candlestick pattern is one of the most successful and widely used forex strategies among retail traders. It is important to trade candlestick in accordance with the above mentioned guidelines and proper money management to earn optimum and consistent earnings.
This article represents the opinion of the Companies operating under the FXOpen brand only. It is not to be construed as an offer, solicitation, or recommendation with respect to products and services provided by the Companies operating under the FXOpen brand, nor is it to be considered financial advice.
Latest articles

Weekly Market Wrap With Gary Thomson: FTSE100, US Dollar, USD/JPY, BTC/USD
Get the latest scoop on the week's hottest headlines, all in one convenient video. Join Gary Thomson, the COO of FXOpen UK, as he breaks down the most significant news reports and shares his expert insights.
- London Calling! FTSE 100

The Price of Silver (XAG/USD) is Falling for the Second Consecutive Week
Following a surge in the price of silver close to the important psychological level of $30 per ounce on April 12, bearish momentum is now evident - concluding the week may mark the second consecutive week of decline for XAG/

AAPL Share Price Soars after Record Buyback Announced
Yesterday, after the end of the main trading session, Apple published its report on its activities for the 1st quarter:
→ Earnings per share: actual = $1.53; expected = $1.505;
→ Gross income: actual = $90.75; expected = $90.36.
The better-than-expected report