


FXOpen
EUR/USD declined sharply after it was rejected near the 1.1770 zone. USD/JPY is gaining momentum and it is trading nicely above the 105.00 level.
Important Takeaways for EUR/USD and USD/JPY
- The Euro failed to hold gains above 1.1750 and declined sharply below 1.1700.
- There was a break below a key bullish trend line with support near 1.1700 on the hourly chart of EUR/USD.
- USD/JPY started a fresh increase after it cleared the 104.75 resistance zone.
- There was a break above a major contracting triangle with resistance near 104.72 on the hourly chart.
EUR/USD Technical Analysis
Recently, there was a decent upward move in the Euro from the 1.1640 support zone against the US Dollar. The EUR/USD pair climbed above the 1.1720 and 1.1750 resistance levels, but it struggled to continue higher.
A high was formed near 1.1769 on FXOpen and there was a sharp decline. The pair tumbled below the 1.1750 and 1.1700 support levels. There was also a break below a key bullish trend line with support near 1.1700 on the hourly chart of EUR/USD.
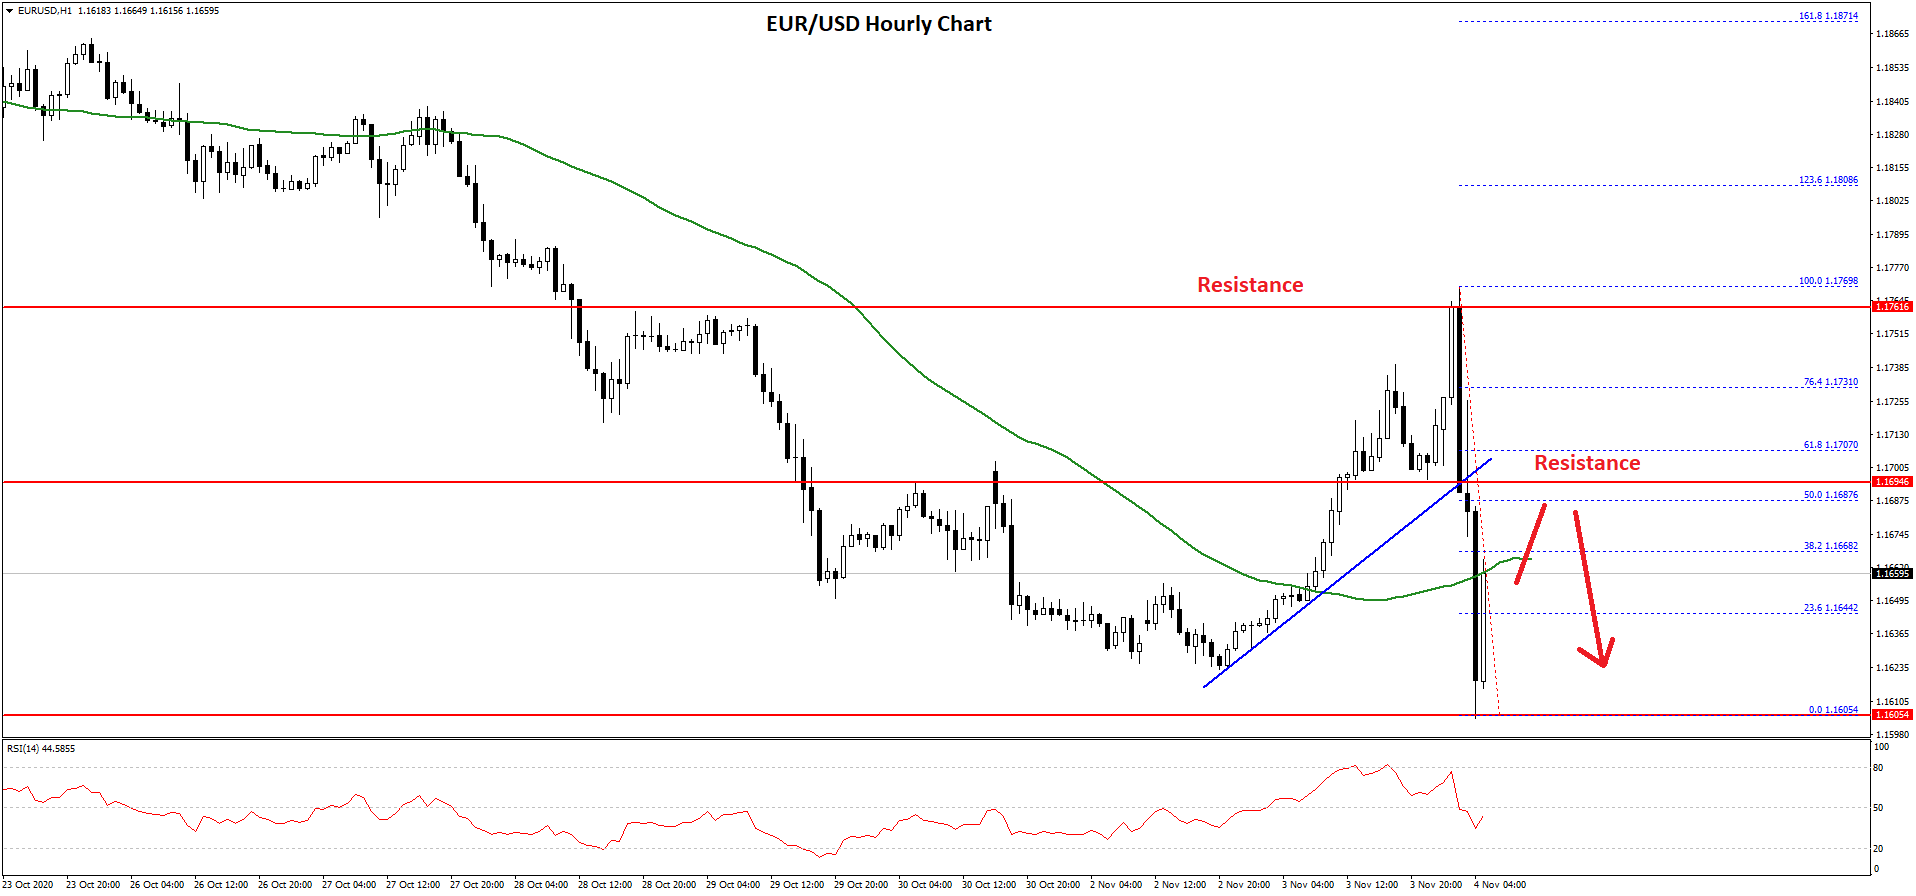
The pair even broke the 1.1680 support level and the 50 hourly simple moving average. The pair traded as low as 1.1605 and it is currently correcting higher.
There was a break above the 1.1640 level, and the pair traded above the 23.6% Fib retracement level of the recent decline from the 1.1769 high to 1.1605 low. However, the pair is facing a strong resistance near the 1.1660 and 1.1680 levels.
The 50 hourly simple moving average is also near the 1.1665 to act as a hurdle. The main hurdle is forming near the 1.1700 zone and the 50% Fib retracement level of the recent decline from the 1.1769 high to 1.1605 low.
On the downside, the 1.1620 level is an initial support. The main support is forming near the 1.1600 zone, below which there is a risk of a sharp decline towards the 1.1550 and 1.1540 levels in the near term.
USD/JPY Technical Analysis
The US Dollar formed a decent support base above 104.20 and started a fresh increase against the Japanese Yen. The USD/JPY pair broke the 104.50 resistance level to move into a positive zone.
There was a clear break above the 104.55 and 104.70 levels. Moreover, there was a break above a major contracting triangle with resistance near 104.72 on the hourly chart. It opened the doors for more gains above the 105.00 resistance level.
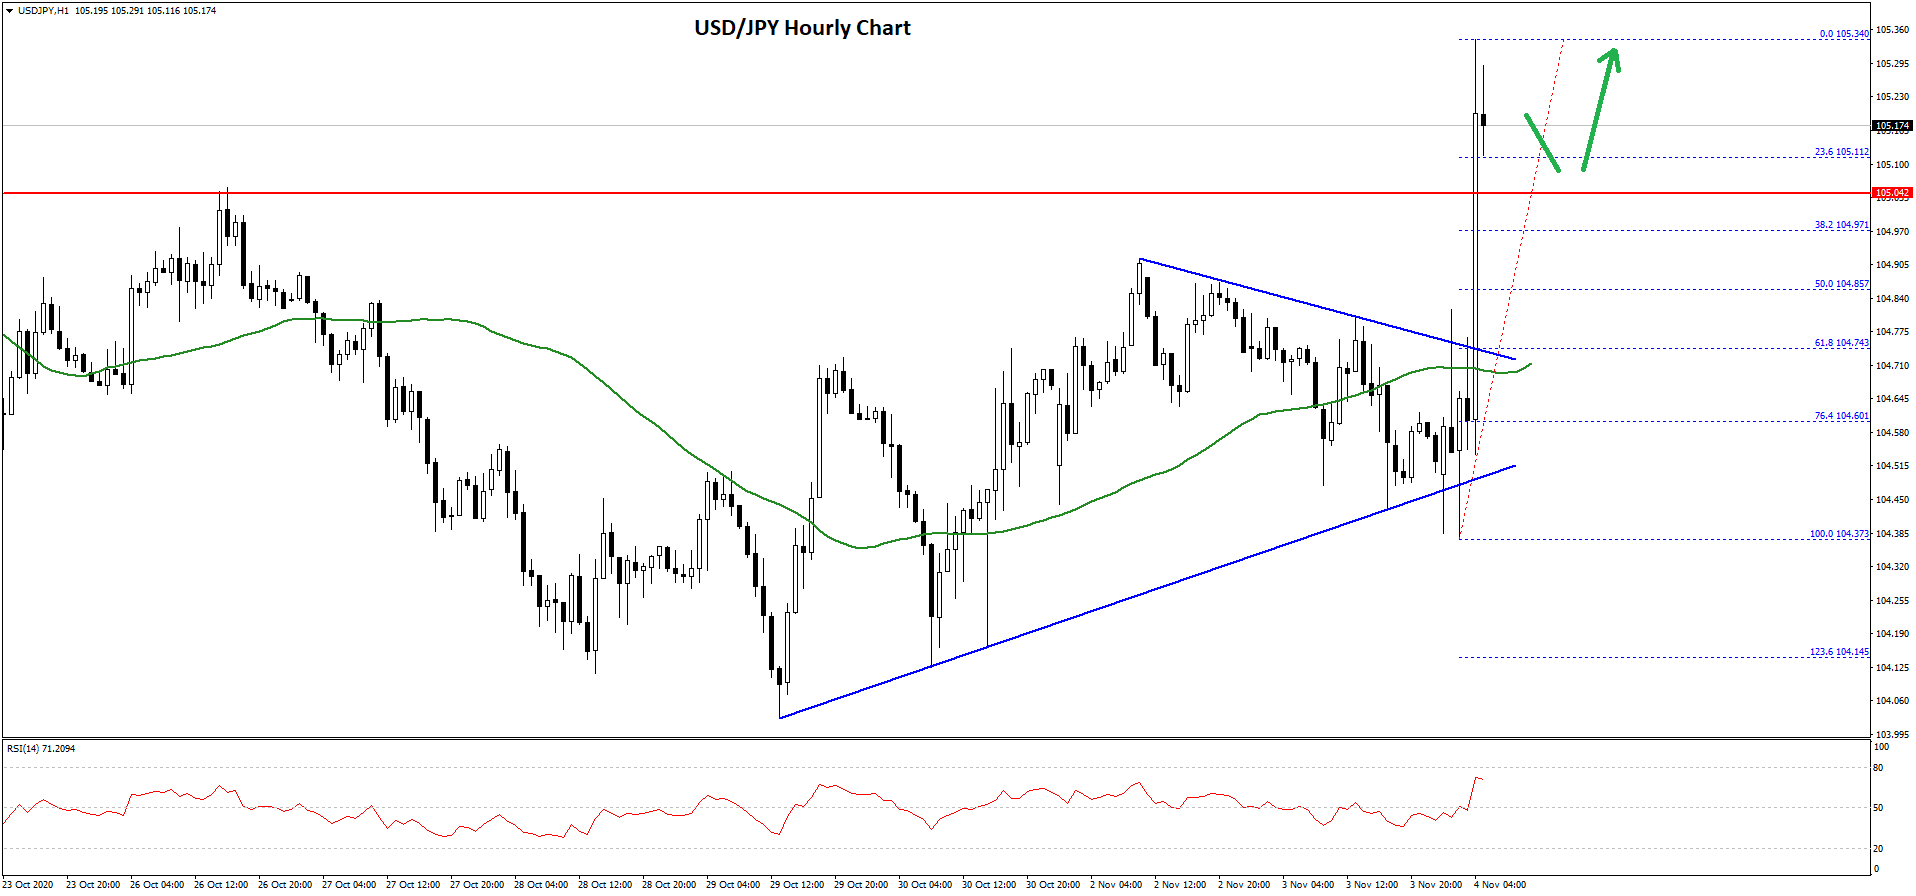
The pair rallied and traded as high as 105.34 and recently started a downside correction. There was a break below the 105.25 level.
An initial support is near the 23.6% Fib retracement level of the recent wave from 104.37 swing low to 105.34 high. The main support is near the 105.00 level (the recent breakout zone). Any further losses could lead it towards the 104.85 support.
The 50% Fib retracement level of the recent wave from 104.37 swing low to 105.34 high is also near the 104.85 level to provide support. The main support is forming near the 104.70 level and the 50 hourly simple moving average.
Conversely, USD/JPY might resume its upward move above the 105.25 and 105.40 levels. The next major hurdle for the bulls is near the 105.80 level.
Trade over 50 forex markets 24 hours a day with FXOpen. Take advantage of low commissions, deep liquidity, and spreads from 0.0 pips. Open your FXOpen account now or learn more about trading forex with FXOpen.
This article represents the opinion of the Companies operating under the FXOpen brand only. It is not to be construed as an offer, solicitation, or recommendation with respect to products and services provided by the Companies operating under the FXOpen brand, nor is it to be considered financial advice.
Latest from Forex Analysis
Latest articles

Weekly Market Wrap With Gary Thomson: S&P500, US Dollar, Gold Price, PEP Stocks
Get he latest scoop on the week's hottest headlines, all in one convenient video. Join Gary Thomson, the COO of FXOpen UK, as he breaks down the most significant news reports and shares his expert insights. Read the latest news

The Price of Silver Has Reached Its Highest Level in Over Three Years
As indicated by the XAG/USD chart today, the intraday price of silver reached $29.84 per ounce yesterday, while the previous yearly high on 12 April was $29.79. The last time this price was seen was in February

What Is the Wolfe Wave, and How Can You Trade It?
The Wolfe Waves is a powerful chart pattern recognised for analysing potential price reversals. Named after Bill Wolfe, who developed this formation through extensive trading practice, Wolfe Waves provide traders with a structured approach to anticipate market movements. In this