


FXOpen
The US Dollar (USD) continued skyrocket movement against the Swiss Franc this week, increasing the price of USD/CHF to more than 0.8970. The Sentiment remains bullish due to Higher Low (HL) in the recent downward wave. The pair has also broken the neckline of the double bottom price pattern, validating more upside rallies in the near future.
Technical Analysis
As of this writing, the pair is being traded near 0.8973. A support can be seen around 0.8955, the low of the yesterday candle ahead of 0.8926, the 50% fib level and then 0.8872, the 38.2% fib level. The pair has already confirmed the bullish sentiment by printing a Higher High on the daily chart.
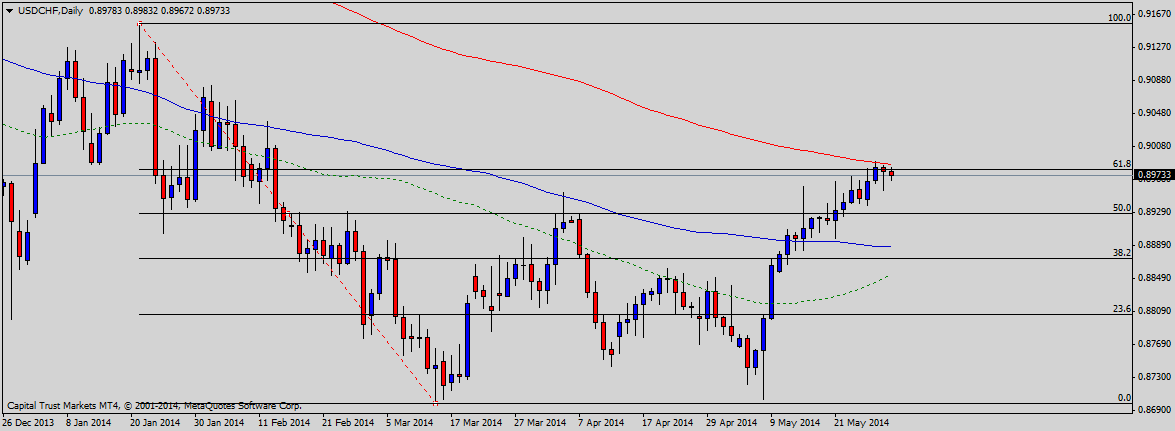
On the upside, the pair is likely to face a hurdle near 0.8987, the 200 Simple Moving Average (SMA) on the daily chart. A break and daily closing above the 200 SMA could spur a renewed buying interest, opening doors for 0.9156 as described above.
KOF Leading Indicators
The leading indicators declined by 0.2 points in May as compared to 1.8 points (revised) reading in the month before, down beating the median projection of 1.95 points increase, a report by the Swiss Economic Institute (KOF) revealed today. Generally speaking, a lower actual reading is considered bullish for USD/CHF and vice versa.
Trade Ideas
Many traders have already gone long following the breakout of the neckline—the highest level between the two bottoms of the price pattern. Those who are still out of the USD/CHF trade, should consider buying on dips near the neckline support area, the buy trade should however be stopped out on a daily closing back below the neckline. Alternatively, selling near 0.9156 may also be a good strategy in the long run, the stop of the sell trade may be placed at 0.9200.
Trade over 50 forex markets 24 hours a day with FXOpen. Take advantage of low commissions, deep liquidity, and spreads from 0.0 pips. Open your FXOpen account now or learn more about trading forex with FXOpen.
This article represents the opinion of the Companies operating under the FXOpen brand only. It is not to be construed as an offer, solicitation, or recommendation with respect to products and services provided by the Companies operating under the FXOpen brand, nor is it to be considered financial advice.
Latest from Forex Analysis
Latest articles

AUD/USD Rises Sharply on Inflation News
The Consumer Price Index for Australia was released this morning. According to ForexFactory:
→ CPI in quarterly terms: actual = 1.0%, expected = 0.8%, previous value = 0.6%;
→ CPI in annual terms: actual = 3.5%, expected = 3.4%, previous value = 3.

TSLA Share Price Up About 13% Despite Disappointing Report
Yesterday, TSLA trading closed at USD 144.68 per share, after which Tesla reported its results for the 1st quarter:
→ earnings per share: actual = USD 0.45, forecast = USD 0.49;
→ gross income: actual = USD 21.45 billion, forecast = USD

Market Analysis: Gold Price Corrects Gains While Oil Price Regains Strength
Gold price rallied above $2,400 before correcting lower. Crude oil price is rising and it could climb further higher toward the $85.50 resistance.
Important Takeaways for Gold and Oil Prices Analysis Today
· Gold price rallied significantly above $2,