


FXOpen
The US dollar upholds the bullish momentum against the Swiss Franc on Monday, crossing the October high and heading towards the 2013 highs ahead of the US ISM manufacturing index
Technical Analysis
As of this writing, the pair is being traded around 0.9661. Opened at 0.9645, the pair is enjoying the upward ride to print a new high for the ongoing year. The price may face a hurdle around 0.9751, the high of July 2013 crossing which will open the way towards the next milestone around 0.9838, the high of 2013.
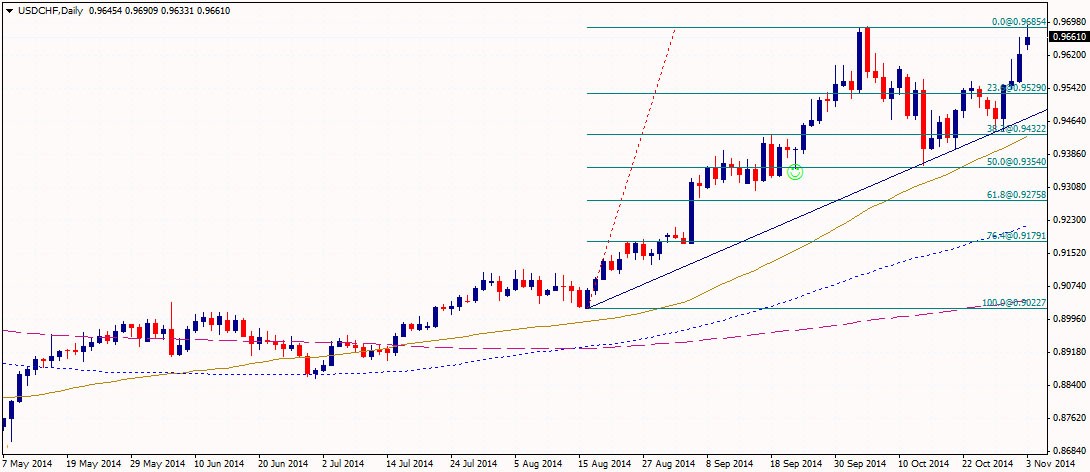
On the downside, the pair will find a support around 0.9432, the confluence of trend line, 38.2% Fib level and 50-Day SMA, as demonstrated in the above chart. Another support can also be seen around 0.9354, the 50% Fib level and the swing low of October.
The overall bias remains bullish because of higher highs and higher lows on the daily chart. The bullish momentum is expected to prevail in the near future as far as the support area 0.9532-0.9354 remains intact.
ISM Manufacturing PMI
The US Manufacturing Index is scheduled to be released by the Institute of Supply Management (ISM) today in the US session. The manufacturing index is projected to be 56.2 points for this October as compared to 56.6 points for the month before, as per the average forecast of different analysts. Generally speaking, a high figure is considered bullish for the US dollar, thus a better than expected figure will further support the upside rally in USD/CHF.
SVME Manufacturing Purchasing Managers Index (PMI)
The Swiss manufacturing index is also due to be released today. As per median projection of different analysts, the manufacturing index for this October is expected to increase to 51.3 points as compared to 50.4 points for the month before. Generally speaking, a high reading is considered bearish for the USD/CHF thus a better than expected outcome may spur selling pressure in the price of the pair.
Trading Strategy
Considering the overall technical and fundamental outlook, selling the pair around the current levels could be a good option in short term if the pair leaves a bearish pin bar or bearish engulfing candle on the daily chart.
Trade over 50 forex markets 24 hours a day with FXOpen. Take advantage of low commissions, deep liquidity, and spreads from 0.0 pips. Open your FXOpen account now or learn more about trading forex with FXOpen.
This article represents the opinion of the Companies operating under the FXOpen brand only. It is not to be construed as an offer, solicitation, or recommendation with respect to products and services provided by the Companies operating under the FXOpen brand, nor is it to be considered financial advice.
Latest from Forex Analysis
Latest articles

Weekly Market Wrap With Gary Thomson: UK100, USD, GOLD, OIL
Get the latest scoop on the week's hottest headlines, all in one convenient video. Join Gary Thomson, the COO of FXOpen UK, as he breaks down the most significant news reports and shares his expert insights.
- UK100 Share Index Rises

What Is a Darvas Box Theory and How Does It Work in Trading?
The Darvas Box Theory, pioneered by Nicolas Darvas in the 1950s, has transcended its stock market origins to become a valuable tool for forex traders. This method leverages specific price movements and patterns, known as the Darvas Box, to track

NFLX Stock Price Falls Despite Subscriber Growth
Yesterday, after the close of the main trading session on the stock market, Netflix reported to investors for the 1st quarter of 2024.
The report turned out better than expected:
→ earnings per share: actual = USD 5.28, forecast = USD 4.