


FXOpen
The US Dollar (USD) extended upside movement against the Japanese Yen (JPY) on Friday, increasing the price of USDJPY for the sixth day in a row to more than 113.00 following the release of some key economic news. The technical bias however remains bearish because of a Lower Low in the recent downside move.
Technical Analysis
As of this writing, the pair is being traded near 113.13. A support may be noted near 112.22, a major horizontal support ahead of 110.66, the swing low of the last major downside move as demonstrated in the following daily chart.
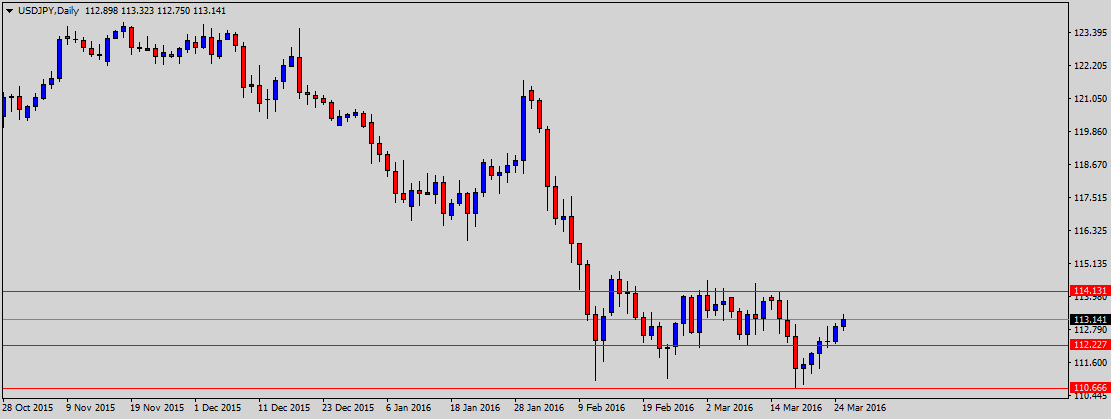
On the upside, the pair is likely to face a hurdle near 114.13, a major horizontal resistance and then 114.55, the high February 2016. A break above the 114.55 resistance area could push the pair into bullish trend, opening doors for a move above 115.00 in near term.
US Durable Goods Orders
New orders for durable goods—products designed to last at least three years, like dishwashers and aircraft—fell a seasonally adjusted 2.8% in February from a month earlier, the Commerce Department said Thursday. Durable-goods statistics are volatile and subject to large revisions. The durable-goods print was broadly in line with expectations: economists surveyed by The Wall Street Journal had forecast a 3% drop in February from the prior month.
Trade Idea
Considering the overall technical and fundamental outlook, selling the pair near 114.00 handle appears to be a good strategy in short to medium term if we get a valid bearish reversal candle near the abovementioned resistance area.
Trade over 50 forex markets 24 hours a day with FXOpen. Take advantage of low commissions, deep liquidity, and spreads from 0.0 pips. Open your FXOpen account now or learn more about trading forex with FXOpen.
This article represents the opinion of the Companies operating under the FXOpen brand only. It is not to be construed as an offer, solicitation, or recommendation with respect to products and services provided by the Companies operating under the FXOpen brand, nor is it to be considered financial advice.
Latest from Forex Analysis
Latest articles

Market Analysis: AUD/USD and NZD/USD Turn Red
AUD/USD declined below the 0.6500 and 0.6455 support levels. NZD/USD is also moving lower and might struggle to recover above 0.5950.
Important Takeaways for AUD/USD and NZD/USD Analysis Today
· The Aussie Dollar started

Since the Start of the Week, Brent Oil Price Has Dropped over 4%
At the beginning of the week, March 15, we wrote that the price of Brent oil could form a correction from the resistance level of USD 91 per barrel. Since then, the price has decreased by more than 4% due

Fair Value Gaps vs Liquidity Voids in Trading
Understanding fair value gaps and liquidity voids is essential for traders seeking to navigate the complexities of the financial markets. These concepts, deeply rooted in the Smart Money Concept (SMC), provide valuable insights into the dynamics of supply and demand,