


FXOpen

A technical trading tool often misunderstood by many retail traders, the Andrews’ Pitchfork is part of every single trading platform that exists. It is over a hundred years old and suffered many changes until the form we use today.
Its origins are based on the law of gravity, as one of its elements, the ML (Median Line), tends to attract price. For this reason, providing it is applied correctly on a chart, Andrew’s Pitchfork gives the future path for the price of any security.
Andrew’s Pitchfork Elements
Andrews Pitchfork is based on three points, called pivots. There is substantial controversy regarding the place for the pivots, but the main idea is that these pivots are the start of three parallel lines.
Conclusively, the three lines show two channels, with the price remaining in one of them for the entire bullish or bearish trend.
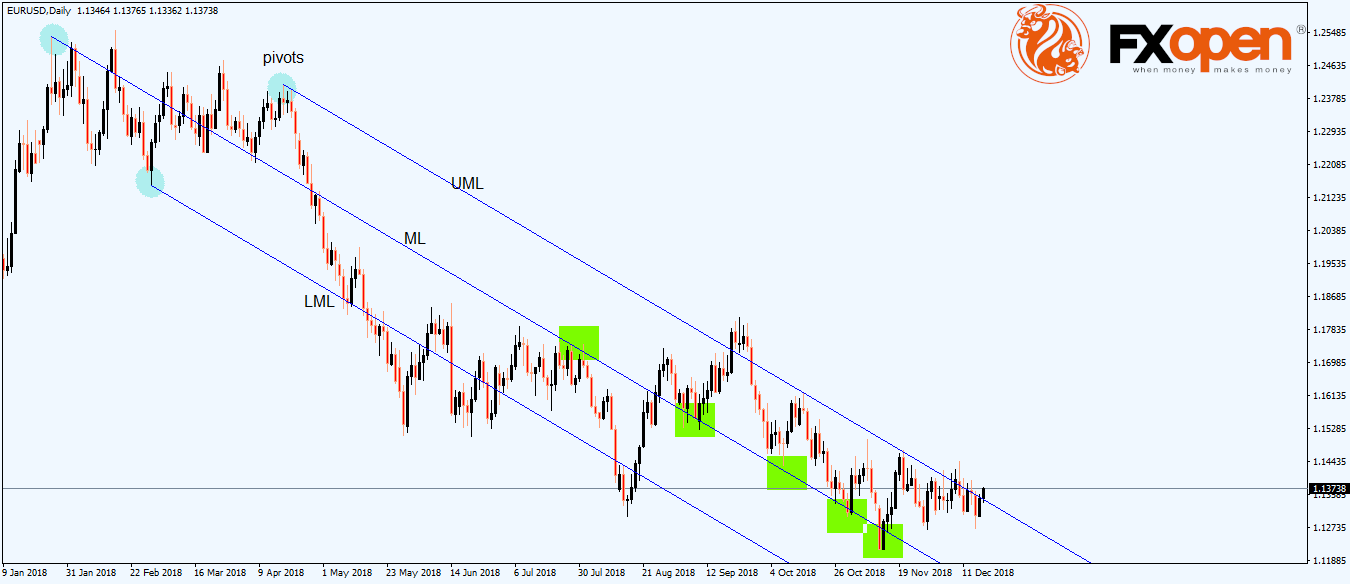
Here’s Andrews Pitchfork on the recent EUR/USD price action. The chart shows the daily slide on the pair from the elevated 1.25 area to the current 1.13-1.14.
The three pivots (blue circles) give the Andrew’s Pitchfork angle, and the resulting lines contain the price for more than ninety percent of the time. The lines are:
- LML – lower median line
- UML – upper median line
- ML – median line
The ML is the most important one as it continues to attract the price. It acts as a gravitational level, with the price attracted regularly.
How to Trade with Andrews Pitchfork
One of the most essential characteristics of Andrews Pitchfork is that it offers strong support and resistance levels.
In technical analysis, support and resistance come in two forms: horizontal and dynamic. The second one is the strongest, as the price continues to make new lows (like in the EURUSD example) while bouncing on dynamic levels. The green areas marked on the earlier chart show what dynamic support is.
Another way to trade with Andrews Pitchfork is to use the Schiff line. More precisely, its projection.
The Schiff line is obtained by connecting the first and the last pivot points. The thick, blue line in the chart below is the Schiff line and, as long as the price remains below, the market maintains the bearish conditions.
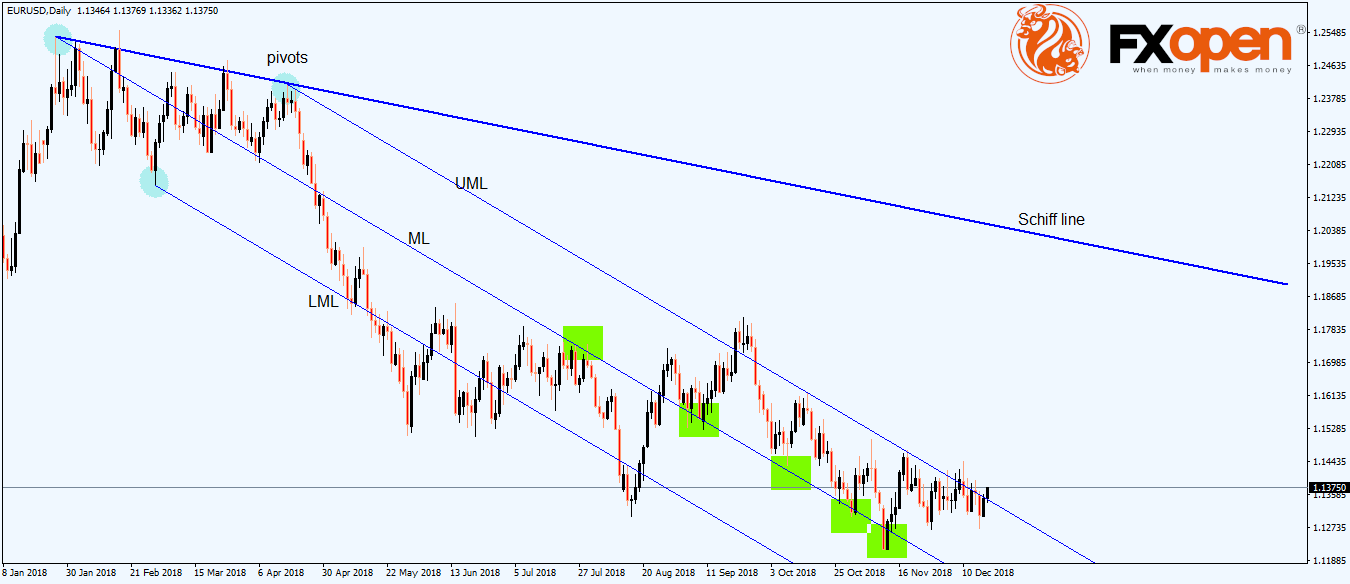
But as it is now, with the price sitting way below the Schiff line, it has not much of a use for the technical trader. However, its angle is very important for projecting dynamic support and resistance levels.
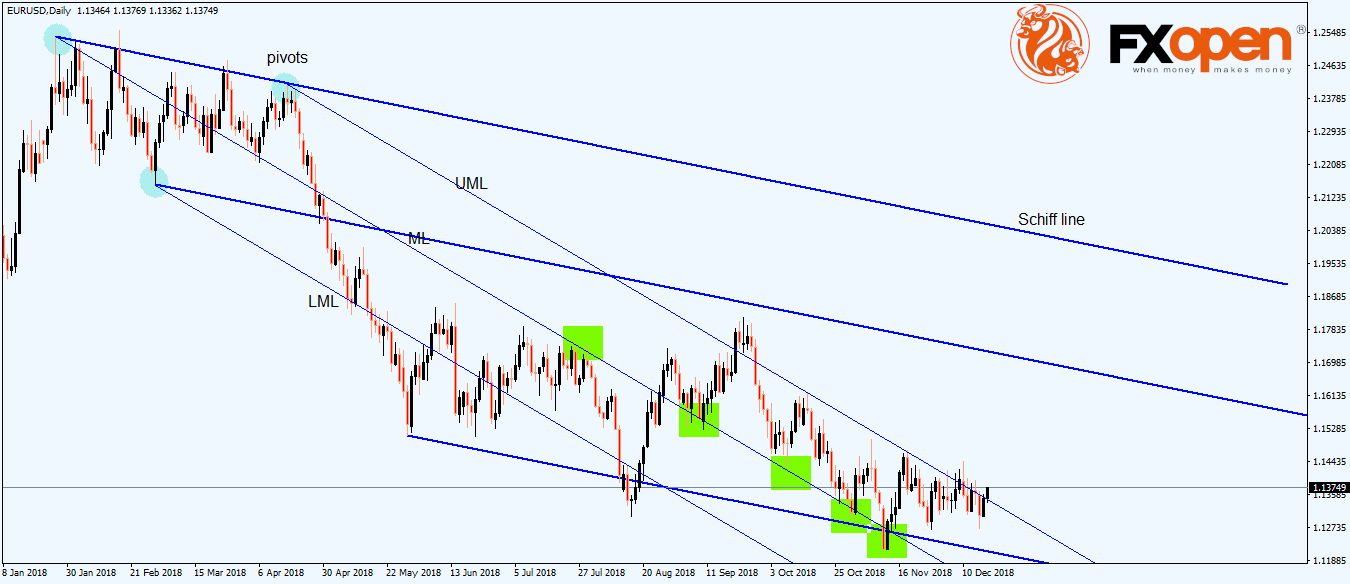
The idea is to copy and paste the Schiff line from previous lower lows (in a bearish trend) or higher highs (in a bullish trend). The resulted lines act as potential support or resistance in bearish and bullish markets, with strong levels, especially if the timeframe is a big one.
Conclusion
For a single technical tool, Andrews Pitchfork is an excellent source of finding support and resistance levels. It contains the price for much of the bearish or bullish trend while serving its purpose even when the price gets out of the falling or rising channels.
Nowadays it is part of every trading platform and the key ingredient to use it correctly is to find the right place for the three pivots. Typically, the series of lower lows and lower highs (in a bearish trend) and higher highs and higher lows (in a bullish trend) will do the trick.
This article represents the opinion of the Companies operating under the FXOpen brand only. It is not to be construed as an offer, solicitation, or recommendation with respect to products and services provided by the Companies operating under the FXOpen brand, nor is it to be considered financial advice.
Latest articles

Germany's DAX 40 Index Flying High Despite Pessimistic National Outlook
For a number of years now, there has been a lot of discourse over the current situation and the future of the German domestic economy.
From both inside Germany and globally, analysts, government officials, and corporate leaders have demonstrated a

Volatility in the Pound Is Rising, the Euro is Consolidating
GBP/USD
At the end of last week, the British currency fell sharply, testing a significant support level at 1.2300. The resumption of the downward trend for the pair became possible after some statements by British officials:
- On Wednesday,

The Price of Gold XAU/USD Shows Strongest Fall in Almost 2 Years
On Monday, the price of gold fell from USD 2,386 to USD 2,333 per ounce — this is the strongest drop in one day in almost 2 years, according to Bloomberg. On Tuesday morning in the Asian session, the