


FXOpen
GBP/USD bounced back after trading towards the 1.2950 level and recovered above 1.3050. AUD/USD is trading in a bullish zone, but it is currently facing a significant resistance near 0.7440.
Important Takeaways for GBP/USD and AUD/USD
- The British Pound recovered after trading as low as 1.2957.
- GBP/USD is currently trading near a major bearish trend line with resistance at 1.3160 on the hourly chart.
- AUD/USD is also facing a tough challenge near the 0.7430/40 resistance zone.
- A break above 0.7440 could push the pair towards the 0.7500 resistance.
GBP/USD Technical Analysis
The British Pound was under a lot of bearish pressure this past week from well above 1.3260 against the US Dollar. The GBP/USD pair started a major downward move and broke many supports such as 1.3220, 1.3150, 1.3080 and 1.3000.
The pair traded close to the 1.2950 support and formed a low at 1.2957. Later, the pair started a decent recovery and traded above the 1.3000 resistance and the 50 hourly simple moving average.
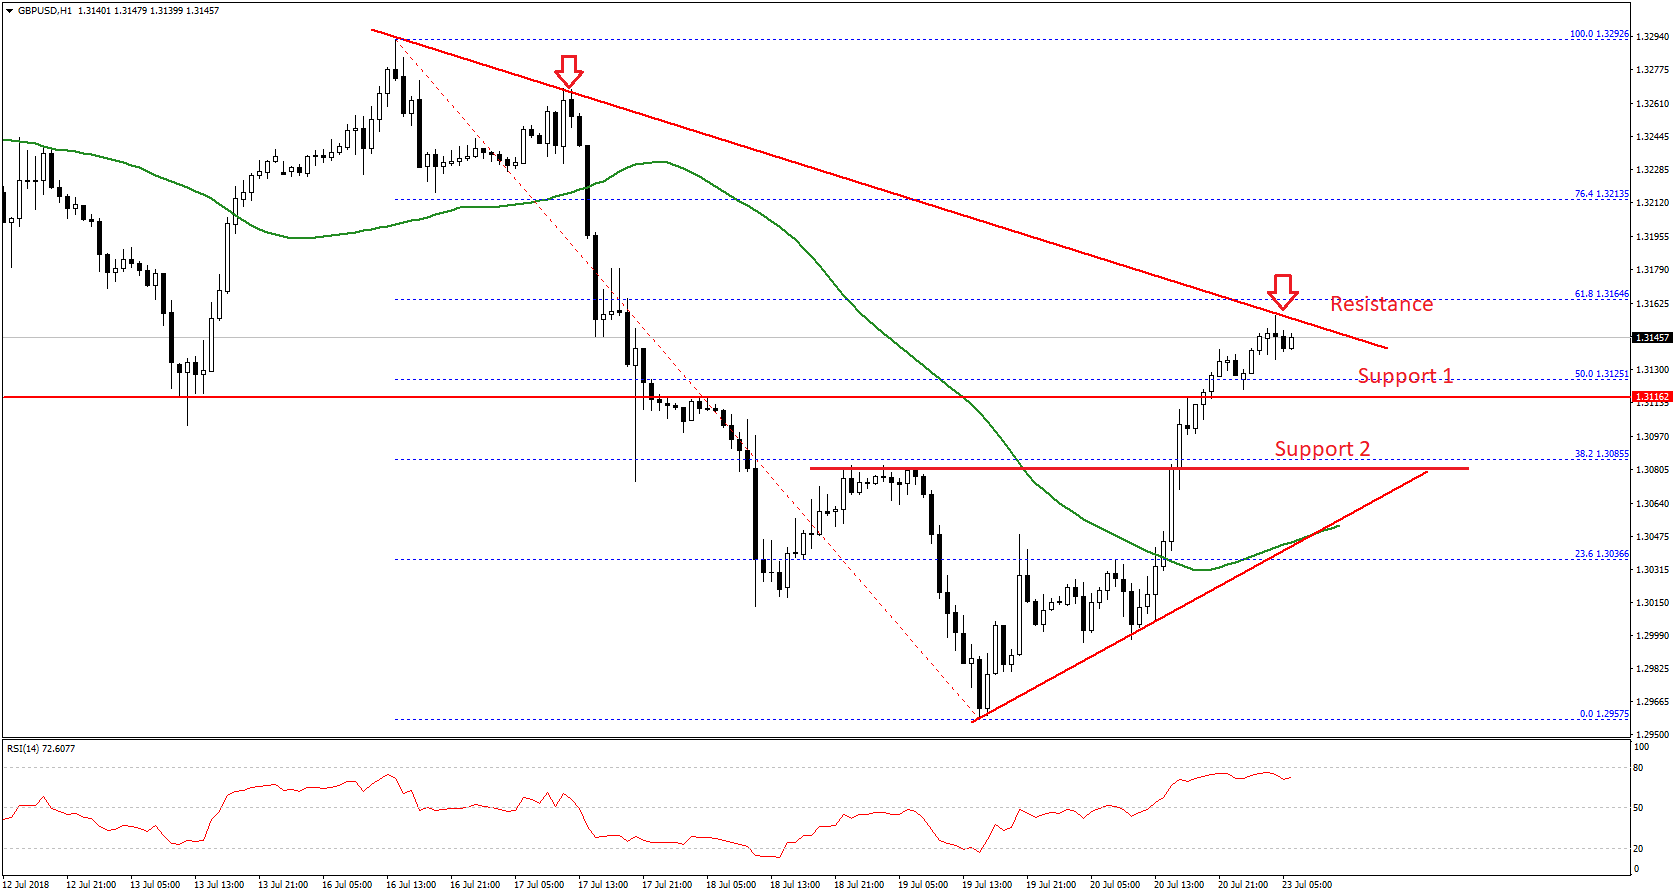
During the upside move, the pair broke the 50% Fib retracement level of the last drop from the 1.3292 high to 1.2957 low. However, the upside move faced a strong resistance near the 1.3160 level. There is also a major bearish trend line in place with resistance at 1.3160 on the hourly chart.
Around the trend line, the 61.8% Fib retracement level of the last drop from the 1.3292 high to 1.2957 low is at 1.3164. Therefore, the pair must clear the trend line and the 1.3164 resistance to gain momentum in the near term.
The next resistance above 1.3164 is near the 1.3200 level, followed by 1.3220. On the flip side, if the pair fails to move above the trend line, it could decline towards the 1.3110 support. Below this, there is a key support formed near 1.3080 and the 50 hourly SMA.
There is also a connecting bullish trend line in place with support at 1.3085. Therefore, as long as the pair is above 1.3080, it is likely to move higher towards 1.3200 in the near term.
AUD/USD Technical Analysis
The Aussie Dollar formed a strong support near 0.7300 and jumped higher against the US Dollar. The AUD/USD traded above the 0.7380 and 0.7400 resistance levels to move into a bullish zone.
The pair even settled above the 0.7380 pivot level and the 50 hourly SMA. However, the upside move stopped near a significant resistance at 0.7440, which prevented an upside break on many occasions.
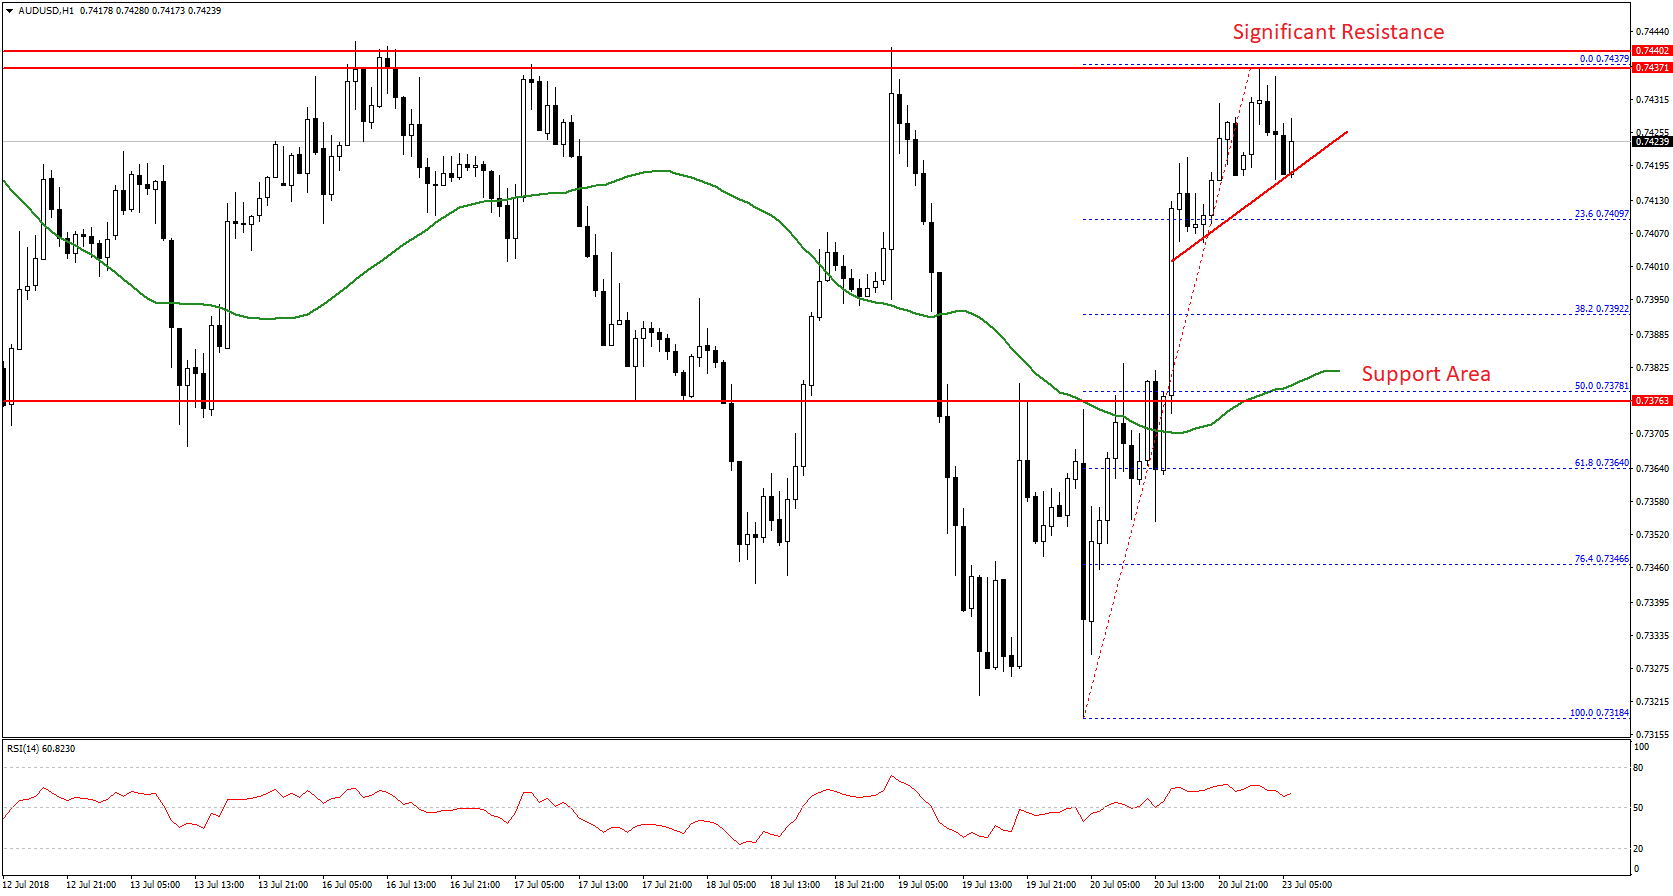
The pair is clearly struggling to move past 0.7440 and is at a risk of a downside move. An initial support is near a connecting bullish trend line with support at 0.7420 on the hourly chart.
Should the pair trade below 0.7420, it could decline towards the 0.7180 support area. The stated support is very important since it is near the 50 hourly SMA and the 50% fib retracement level of the last wave from the 0.7318 low to 0.7437 high.
On the other hand, a break above the 0.7400 resistance may perhaps open the doors for a move towards the 0.7500 resistance.
Trade over 50 forex markets 24 hours a day with FXOpen. Take advantage of low commissions, deep liquidity, and spreads from 0.0 pips. Open your FXOpen account now or learn more about trading forex with FXOpen.
This article represents the opinion of the Companies operating under the FXOpen brand only. It is not to be construed as an offer, solicitation, or recommendation with respect to products and services provided by the Companies operating under the FXOpen brand, nor is it to be considered financial advice.
Latest from Forex Analysis
Latest articles

Google Share Price Rose Post-market to a New All-time Record
Yesterday, after the close of the main trading session, a report on activities for the 1st quarter of Alphabet Inc. (Google's parent company) was published. The report was strong, exceeding investors' expectations.
→ Quarterly EPS = USD 1.89 (expected = USD 1.

S&P 500 Rebounds after Negative GDP News
Data released yesterday showed US GDP growth slowed to 1.6% in the first quarter of the year. According to ForexFactory: forecast = 2.2%, past value = 2.4%.
Reaction to the news sent the S&P 500 mini stock

GBP/USD And USD/CAD Daily Chart Outlook
GBP/USD is attempting a recovery wave from 1.2300. USD/CAD is consolidating and might aim for a move above the 1.3760 resistance zone.
Important Takeaways for GBP/USD and USD/CAD Analysis Today
· The British Pound started