


FXOpen
Gold price is correcting higher, but it is facing a major resistance near $1,248. Crude oil price is under pressure, and on the upside, there are key resistances near $70.25 and $70.70.
Important Takeaways for Gold and Oil
- Gold price declined this week and settled below the $1,250 support against the US Dollar.
- There is a crucial bearish trend line formed with resistance near $1,247-48 on the hourly chart of gold.
- Crude oil price is likely to face many resistances on the upside like $70.25 and $70.70.
- China’s Trade Balance in June 2018 posted a surplus of $41.60B, well above the forecast of $27.61B.
Gold Price Technical Analysis
Gold price remained in a downtrend this week from well above the $1,260 pivot level against the US Dollar. The price declined and broke many supports such as $1,254 and $1,250.
It traded towards the $1,240 level and formed a low near $1,241. It is currently correcting higher and it already moved above the $1,244 resistance. It also broke the 23.6% Fib retracement level of the last decline from the $1,256 high to $1,241 low.
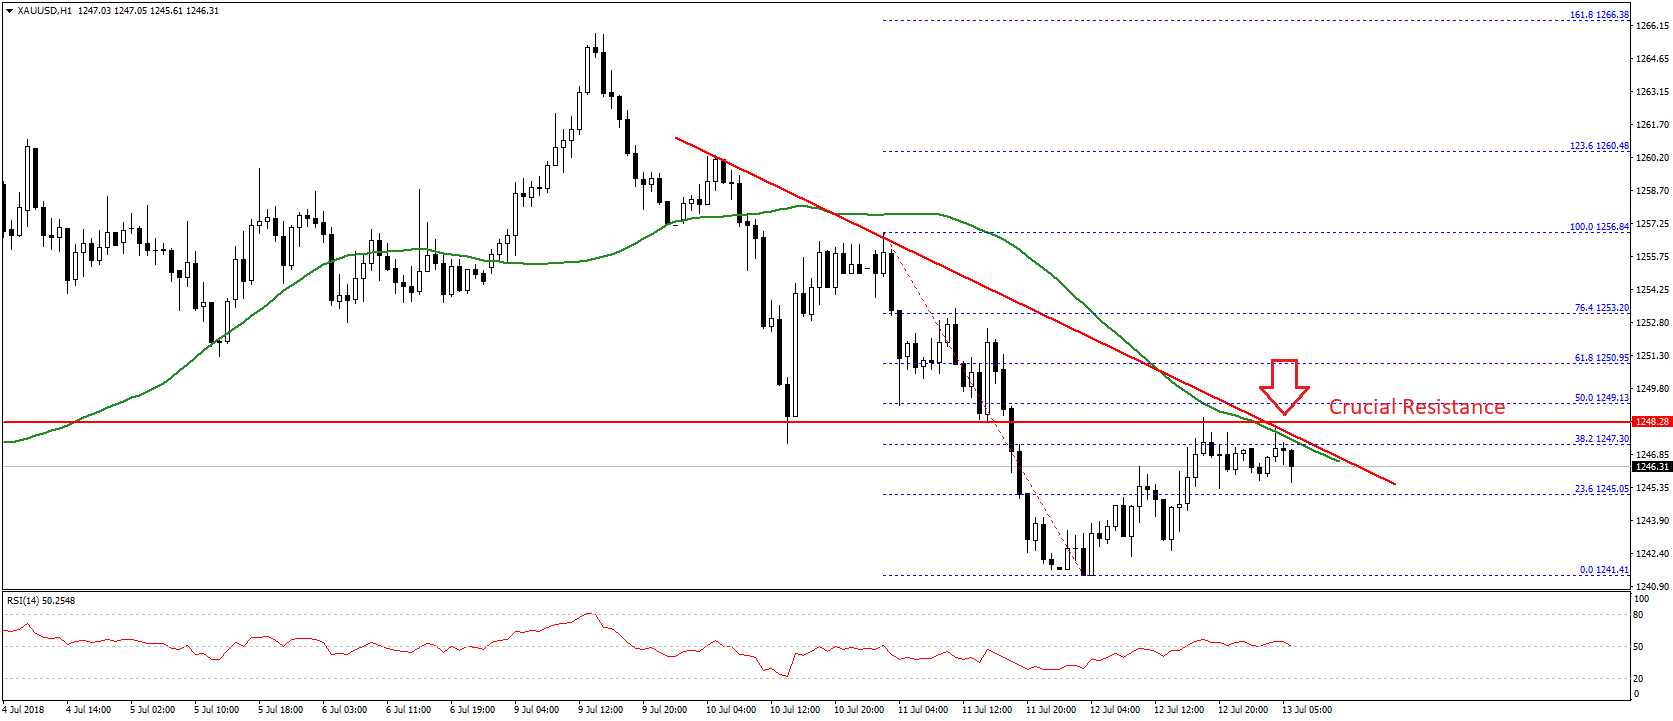
However, there is a significant resistance formed near $1,248 and the 50 hourly simple moving average. There is also a crucial bearish trend line formed with resistance near $1,247-47 on the hourly chart of gold.
The trend line resistance is positioned just below the 50% Fib retracement level of the last decline from the $1,256 high to $1,241 low. Therefore, a break and close above $1,248-50 won’t be easy. If buyers succeed, the price could move back in a bullish zone towards the next resistance at $1,255.
On the flip side, if the $1,248 resistance and 50 hourly SMA continue to prevent upsides, the price may perhaps drop again and resume its downtrend. Supports on the downside are seen near $1,244 and $1,241.
Oil Price Technical Analysis
Crude oil price dropped heavily during the past three days after setting a short-term top near the $73.35 level against the US Dollar. The price declined and broke supports like $72.50, $71.00 and $70.00 to settle below the 50 hourly simple moving average.
The decline was such that the price traded close to the $68.00 level and formed a low at $68.26. Later, the price started an upside correction and moved above $69.00.
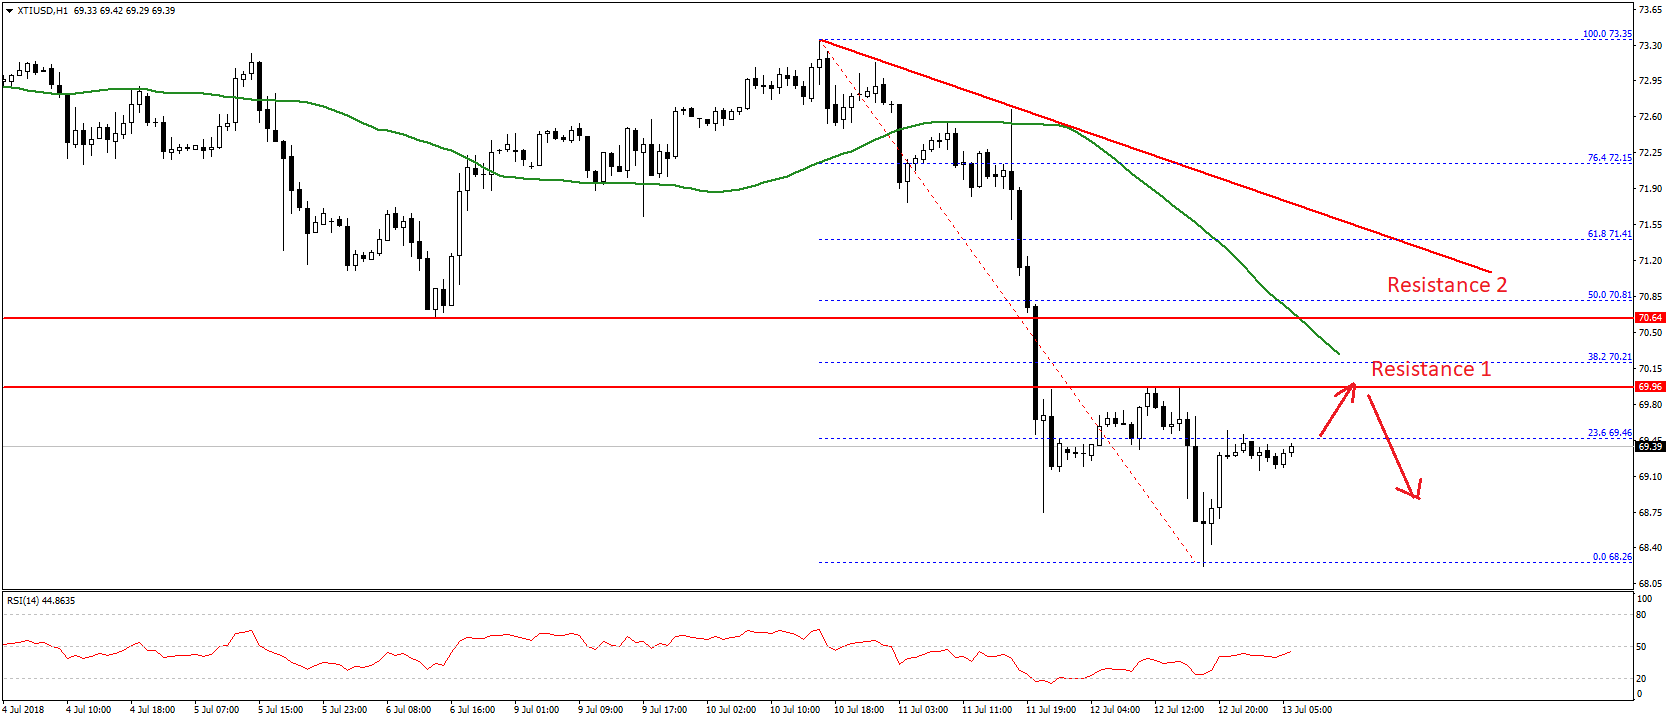
At the moment, it is testing the 23.6% Fib retracement level of the last drop from the $73.35 high to $68.26 low. Above this, there are many resistances on the upside near the $70.25 level and the 50 hourly SMA.
There is also a key bearish trend line with resistance at $70.80 on the hourly chart. It coincides with the 50% Fib retracement level of the last drop from the $73.35 high to $68.26 low. Moreover, the 50 hourly SMA is positioned near $70.30.
Therefore, it seems like there are many hurdles for buyers above the $70.25 level up to $70.80. As long as the price is below $71.00, it remains in a downtrend. Supports are seen near $69.00 and $68.20.
Recently in China, the Trade Balance figures for June 2018 were published. The market was looking for a trade surplus of around $27.61B, but the result was positive since there was a surplus of $41.60B.
It could help gold price in gaining traction, but a break above the mentioned $1,248 resistance won’t be easy in the near term.
Trade over 50 forex markets 24 hours a day with FXOpen. Take advantage of low commissions, deep liquidity, and spreads from 0.0 pips. Open your FXOpen account now or learn more about trading forex with FXOpen.
This article represents the opinion of the Companies operating under the FXOpen brand only. It is not to be construed as an offer, solicitation, or recommendation with respect to products and services provided by the Companies operating under the FXOpen brand, nor is it to be considered financial advice.
Latest from Forex Analysis
Latest articles

Google Share Price Rose Post-market to a New All-time Record
Yesterday, after the close of the main trading session, a report on activities for the 1st quarter of Alphabet Inc. (Google's parent company) was published. The report was strong, exceeding investors' expectations.
→ Quarterly EPS = USD 1.89 (expected = USD 1.

S&P 500 Rebounds after Negative GDP News
Data released yesterday showed US GDP growth slowed to 1.6% in the first quarter of the year. According to ForexFactory: forecast = 2.2%, past value = 2.4%.
Reaction to the news sent the S&P 500 mini stock

GBP/USD And USD/CAD Daily Chart Outlook
GBP/USD is attempting a recovery wave from 1.2300. USD/CAD is consolidating and might aim for a move above the 1.3760 resistance zone.
Important Takeaways for GBP/USD and USD/CAD Analysis Today
· The British Pound started